Immigrants from Armenia vs Immigrants from Portugal Currently Married

COMPARE

Immigrants from Armenia
Race
Ancestry
AfghanAfricanAlaska NativeAlaskan AthabascanAlbanianAleutAlsatianAmericanApacheArabArapahoArgentineanArmenianAssyrian/Chaldean/SyriacAustralianAustrianBahamianBangladeshiBarbadianBasqueBelgianBelizeanBermudanBhutaneseBlackfeetBolivianBrazilianBritishBritish West IndianBulgarianBurmeseCajunCambodianCanadianCape VerdeanCarpatho RusynCelticCentral AmericanCentral American IndianCherokeeCheyenneChickasawChileanChineseChippewaChoctawColombianColvilleComancheCosta RicanCreeCreekCroatianCrowCubanCypriotCzechCzechoslovakianDanishDelawareDominicanDutchDutch West IndianEastern EuropeanEcuadorianEgyptianEnglishEstonianEthiopianEuropeanFijianFilipinoFinnishFrenchFrench American IndianFrench CanadianGermanGerman RussianGhanaianGreekGuamanian/ChamorroGuatemalanGuyaneseHaitianHmongHonduranHopiHoumaHungarianIcelanderIndian (Asian)IndonesianInupiatIranianIraqiIrishIroquoisIsraeliItalianJamaicanJapaneseJordanianKenyanKiowaKoreanLaotianLatvianLebaneseLiberianLithuanianLumbeeLuxembourgerMacedonianMalaysianMalteseMarshalleseMenomineeMexicanMexican American IndianMongolianMoroccanNative HawaiianNavajoNepaleseNew ZealanderNicaraguanNigerianNorthern EuropeanNorwegianOkinawanOsageOttawaPaiutePakistaniPalestinianPanamanianParaguayanPennsylvania GermanPeruvianPimaPolishPortuguesePotawatomiPuebloPuerto RicanPuget Sound SalishRomanianRussianSalvadoranSamoanScandinavianScotch-IrishScottishSeminoleSenegaleseSerbianShoshoneSierra LeoneanSiouxSlavicSlovakSloveneSomaliSouth AfricanSouth AmericanSouth American IndianSoviet UnionSpaniardSpanishSpanish AmericanSpanish American IndianSri LankanSubsaharan AfricanSudaneseSwedishSwissSyrianTaiwaneseThaiTlingit-HaidaTohono O'OdhamTonganTrinidadian and TobagonianTsimshianTurkishU.S. Virgin IslanderUgandanUkrainianUruguayanUteVenezuelanVietnameseWelshWest IndianYakamaYaquiYugoslavianYumanYup'ikZimbabwean
Immigration
NonimmigrantsImmigrantsAfghanistanAfricaAlbaniaArgentinaArmeniaAsiaAustraliaAustriaBahamasBangladeshBarbadosBelarusBelgiumBelizeBoliviaBosnia and HerzegovinaBrazilBulgariaBurma/MyanmarCabo VerdeCambodiaCameroonCanadaCaribbeanCentral AmericaChileChinaColombiaCongoCosta RicaCroatiaCubaCzechoslovakiaDenmarkDominicaDominican RepublicEastern AfricaEastern AsiaEastern EuropeEcuadorEgyptEl SalvadorEnglandEritreaEthiopiaEuropeFijiFranceGermanyGhanaGreeceGrenadaGuatemalaGuyanaHaitiHondurasHong KongHungaryIndiaIndonesiaIranIraqIrelandIsraelItalyJamaicaJapanJordanKazakhstanKenyaKoreaKuwaitLaosLatin AmericaLatviaLebanonLiberiaLithuaniaMalaysiaMexicoMicronesiaMiddle AfricaMoldovaMoroccoNepalNetherlandsNicaraguaNigeriaNorth AmericaNorth MacedoniaNorthern AfricaNorthern EuropeNorwayOceaniaPakistanPanamaPeruPhilippinesPolandRomaniaRussiaSaudi ArabiaScotlandSenegalSerbiaSierra LeoneSingaporeSomaliaSouth AfricaSouth AmericaSouth Central AsiaSouth Eastern AsiaSouthern EuropeSpainSri LankaSt. Vincent and the GrenadinesSudanSwedenSwitzerlandSyriaTaiwanThailandTrinidad and TobagoTurkeyUgandaUkraineUruguayUzbekistanVenezuelaVietnamWest IndiesWestern AfricaWestern AsiaWestern EuropeYemenZaireZimbabweAzores
Immigrants from Portugal
Race
Ancestry
AfghanAfricanAlaska NativeAlaskan AthabascanAlbanianAleutAlsatianAmericanApacheArabArapahoArgentineanArmenianAssyrian/Chaldean/SyriacAustralianAustrianBahamianBangladeshiBarbadianBasqueBelgianBelizeanBermudanBhutaneseBlackfeetBolivianBrazilianBritishBritish West IndianBulgarianBurmeseCajunCambodianCanadianCape VerdeanCarpatho RusynCelticCentral AmericanCentral American IndianCherokeeCheyenneChickasawChileanChineseChippewaChoctawColombianColvilleComancheCosta RicanCreeCreekCroatianCrowCubanCypriotCzechCzechoslovakianDanishDelawareDominicanDutchDutch West IndianEastern EuropeanEcuadorianEgyptianEnglishEstonianEthiopianEuropeanFijianFilipinoFinnishFrenchFrench American IndianFrench CanadianGermanGerman RussianGhanaianGreekGuamanian/ChamorroGuatemalanGuyaneseHaitianHmongHonduranHopiHoumaHungarianIcelanderIndian (Asian)IndonesianInupiatIranianIraqiIrishIroquoisIsraeliItalianJamaicanJapaneseJordanianKenyanKiowaKoreanLaotianLatvianLebaneseLiberianLithuanianLumbeeLuxembourgerMacedonianMalaysianMalteseMarshalleseMenomineeMexicanMexican American IndianMongolianMoroccanNative HawaiianNavajoNepaleseNew ZealanderNicaraguanNigerianNorthern EuropeanNorwegianOkinawanOsageOttawaPaiutePakistaniPalestinianPanamanianParaguayanPennsylvania GermanPeruvianPimaPolishPortuguesePotawatomiPuebloPuerto RicanPuget Sound SalishRomanianRussianSalvadoranSamoanScandinavianScotch-IrishScottishSeminoleSenegaleseSerbianShoshoneSierra LeoneanSiouxSlavicSlovakSloveneSomaliSouth AfricanSouth AmericanSouth American IndianSoviet UnionSpaniardSpanishSpanish AmericanSpanish American IndianSri LankanSubsaharan AfricanSudaneseSwedishSwissSyrianTaiwaneseThaiTlingit-HaidaTohono O'OdhamTonganTrinidadian and TobagonianTsimshianTurkishU.S. Virgin IslanderUgandanUkrainianUruguayanUteVenezuelanVietnameseWelshWest IndianYakamaYaquiYugoslavianYumanYup'ikZimbabwean
Immigration
NonimmigrantsImmigrantsAfghanistanAfricaAlbaniaArgentinaAsiaAustraliaAustriaBahamasBangladeshBarbadosBelarusBelgiumBelizeBoliviaBosnia and HerzegovinaBrazilBulgariaBurma/MyanmarCabo VerdeCambodiaCameroonCanadaCaribbeanCentral AmericaChileChinaColombiaCongoCosta RicaCroatiaCubaCzechoslovakiaDenmarkDominicaDominican RepublicEastern AfricaEastern AsiaEastern EuropeEcuadorEgyptEl SalvadorEnglandEritreaEthiopiaEuropeFijiFranceGermanyGhanaGreeceGrenadaGuatemalaGuyanaHaitiHondurasHong KongHungaryIndiaIndonesiaIranIraqIrelandIsraelItalyJamaicaJapanJordanKazakhstanKenyaKoreaKuwaitLaosLatin AmericaLatviaLebanonLiberiaLithuaniaMalaysiaMexicoMicronesiaMiddle AfricaMoldovaMoroccoNepalNetherlandsNicaraguaNigeriaNorth AmericaNorth MacedoniaNorthern AfricaNorthern EuropeNorwayOceaniaPakistanPanamaPeruPhilippinesPolandPortugalRomaniaRussiaSaudi ArabiaScotlandSenegalSerbiaSierra LeoneSingaporeSomaliaSouth AfricaSouth AmericaSouth Central AsiaSouth Eastern AsiaSouthern EuropeSpainSri LankaSt. Vincent and the GrenadinesSudanSwedenSwitzerlandSyriaTaiwanThailandTrinidad and TobagoTurkeyUgandaUkraineUruguayUzbekistanVenezuelaVietnamWest IndiesWestern AfricaWestern AsiaWestern EuropeYemenZaireZimbabweAzores
Currently Married
Income
Poverty
Unemployment
Labor Participation
Family Structure
Vehicle Availability
Education Level
Disability

Currently Married Comparison

Immigrants from Armenia

Immigrants from Portugal

Tragic
Tragic
44.3%
CURRENTLY MARRIED
0.4/ 100
METRIC RATING
245th/ 347
METRIC RANK
45.2%
CURRENTLY MARRIED
3.5/ 100
METRIC RATING
219th/ 347
METRIC RANK

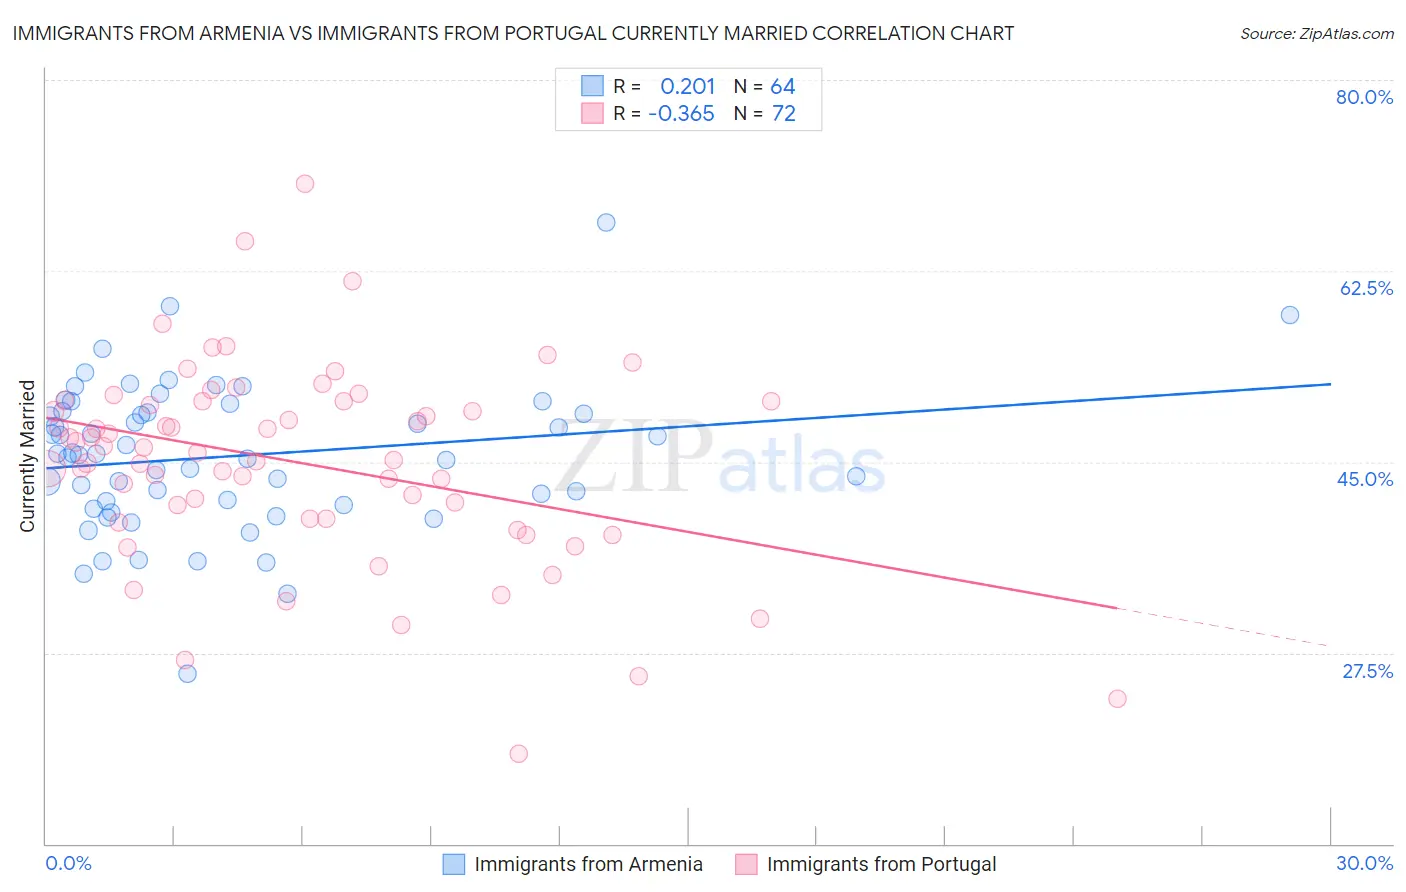
Immigrants from Armenia vs Immigrants from Portugal Currently Married Correlation Chart

The statistical analysis conducted on geographies consisting of 97,725,276 people shows a weak positive correlation between the proportion of Immigrants from Armenia and percentage of population currently married in the United States with a correlation coefficient (R) of 0.201 and weighted average of 44.3%. Similarly, the statistical analysis conducted on geographies consisting of 174,784,868 people shows a mild negative correlation between the proportion of Immigrants from Portugal and percentage of population currently married in the United States with a correlation coefficient (R) of -0.365 and weighted average of 45.2%, a difference of 2.0%.
Immigrants from Armenia vs Immigrants from Portugal Currently Married

Currently Married Correlation Summary

MeasurementImmigrants from ArmeniaImmigrants from Portugal
Minimum25.6%18.3%
Maximum66.9%70.5%
Range41.3%52.2%
Mean45.5%44.9%
Median45.7%46.1%
Interquartile 25% (IQ1)41.2%39.8%
Interquartile 75% (IQ3)49.6%50.5%
Interquartile Range (IQR)8.3%10.8%
Standard Deviation (Sample)6.8%9.1%
Standard Deviation (Population)6.7%9.1%

Similar Demographics by Currently Married

Demographics Similar to Immigrants from Armenia by Currently Married

In terms of currently married, the demographic groups most similar to Immigrants from Armenia are Immigrants from Burma/Myanmar (44.3%, a difference of 0.070%), Ugandan (44.2%, a difference of 0.20%), Nicaraguan (44.2%, a difference of 0.29%), Immigrants from Cameroon (44.2%, a difference of 0.30%), and Japanese (44.5%, a difference of 0.31%).
DemographicsRating | RankCurrently Married
Moroccans
0.9
/100
|
#238
Tragic
44.6%
Immigrants | Mexico
0.7
/100
|
#239
Tragic
44.5%
Mexican American Indians
0.7
/100
|
#240
Tragic
44.5%
Ethiopians
0.7
/100
|
#241
Tragic
44.5%
Immigrants | Cambodia
0.7
/100
|
#242
Tragic
44.5%
Immigrants | Ethiopia
0.7
/100
|
#243
Tragic
44.5%
Japanese
0.6
/100
|
#244
Tragic
44.5%
Immigrants | Armenia
0.4
/100
|
#245
Tragic
44.3%
Immigrants | Burma/Myanmar
0.4
/100
|
#246
Tragic
44.3%
Ugandans
0.4
/100
|
#247
Tragic
44.2%
Nicaraguans
0.3
/100
|
#248
Tragic
44.2%
Immigrants | Cameroon
0.3
/100
|
#249
Tragic
44.2%
Immigrants | Eastern Africa
0.3
/100
|
#250
Tragic
44.2%
Blackfeet
0.3
/100
|
#251
Tragic
44.2%
Hispanics or Latinos
0.3
/100
|
#252
Tragic
44.1%

Demographics Similar to Immigrants from Portugal by Currently Married

In terms of currently married, the demographic groups most similar to Immigrants from Portugal are Panamanian (45.3%, a difference of 0.12%), Kenyan (45.2%, a difference of 0.13%), Mexican (45.2%, a difference of 0.14%), Immigrants from the Azores (45.1%, a difference of 0.34%), and Immigrants from Thailand (45.4%, a difference of 0.36%).
DemographicsRating | RankCurrently Married
Marshallese
7.2
/100
|
#212
Tragic
45.5%
Alaska Natives
7.0
/100
|
#213
Tragic
45.5%
Dutch West Indians
6.7
/100
|
#214
Tragic
45.5%
German Russians
6.7
/100
|
#215
Tragic
45.5%
Immigrants | Morocco
5.5
/100
|
#216
Tragic
45.4%
Immigrants | Thailand
5.1
/100
|
#217
Tragic
45.4%
Panamanians
4.0
/100
|
#218
Tragic
45.3%
Immigrants | Portugal
3.5
/100
|
#219
Tragic
45.2%
Kenyans
3.1
/100
|
#220
Tragic
45.2%
Mexicans
3.0
/100
|
#221
Tragic
45.2%
Immigrants | Azores
2.5
/100
|
#222
Tragic
45.1%
Immigrants | Laos
2.3
/100
|
#223
Tragic
45.0%
Immigrants | Uganda
2.2
/100
|
#224
Tragic
45.0%
French American Indians
2.2
/100
|
#225
Tragic
45.0%
Comanche
2.1
/100
|
#226
Tragic
45.0%