Puget Sound Salish vs Blackfeet Divorced or Separated
COMPARE
Puget Sound Salish
Blackfeet
Divorced or Separated
Divorced or Separated Comparison
Puget Sound Salish
Blackfeet
13.4%
DIVORCED OR SEPARATED
0.0/ 100
METRIC RATING
319th/ 347
METRIC RANK
13.3%
DIVORCED OR SEPARATED
0.0/ 100
METRIC RATING
312th/ 347
METRIC RANK
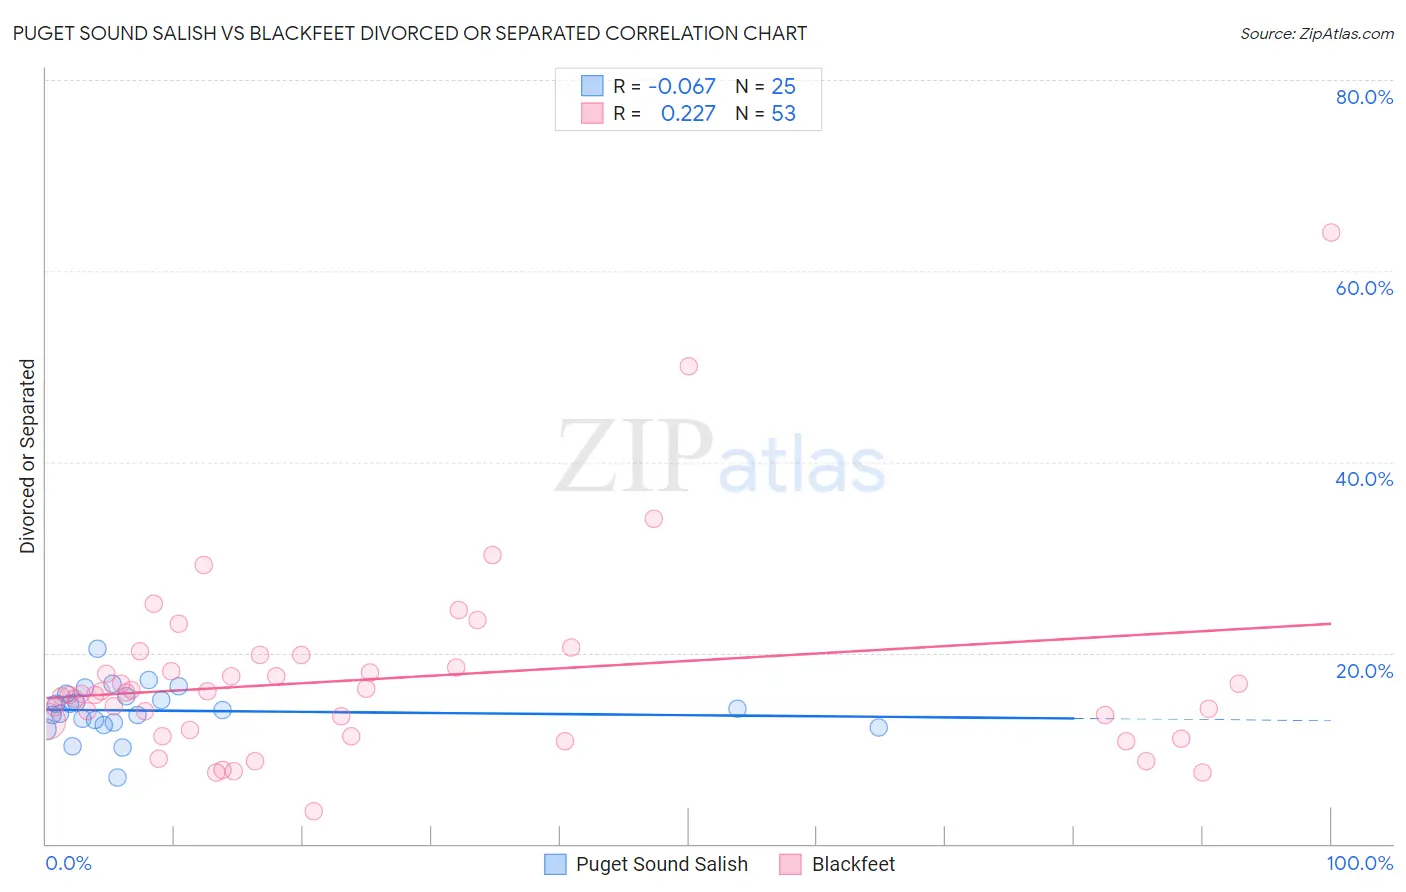
Puget Sound Salish vs Blackfeet Divorced or Separated Correlation Chart
The statistical analysis conducted on geographies consisting of 46,155,746 people shows a slight negative correlation between the proportion of Puget Sound Salish and percentage of population currently divorced or separated in the United States with a correlation coefficient (R) of -0.067 and weighted average of 13.4%. Similarly, the statistical analysis conducted on geographies consisting of 309,547,647 people shows a weak positive correlation between the proportion of Blackfeet and percentage of population currently divorced or separated in the United States with a correlation coefficient (R) of 0.227 and weighted average of 13.3%, a difference of 0.55%.
Divorced or Separated Correlation Summary
| Measurement | Puget Sound Salish | Blackfeet |
| Minimum | 6.9% | 3.4% |
| Maximum | 20.4% | 64.0% |
| Range | 13.5% | 60.6% |
| Mean | 13.9% | 17.3% |
| Median | 14.0% | 15.7% |
| Interquartile 25% (IQ1) | 12.5% | 11.6% |
| Interquartile 75% (IQ3) | 15.6% | 19.1% |
| Interquartile Range (IQR) | 3.0% | 7.6% |
| Standard Deviation (Sample) | 2.7% | 10.0% |
| Standard Deviation (Population) | 2.6% | 9.9% |
Demographics Similar to Puget Sound Salish and Blackfeet by Divorced or Separated
In terms of divorced or separated, the demographic groups most similar to Puget Sound Salish are Cree (13.4%, a difference of 0.040%), Haitian (13.3%, a difference of 0.060%), Cajun (13.4%, a difference of 0.060%), Tsimshian (13.3%, a difference of 0.080%), and Spanish American (13.3%, a difference of 0.12%). Similarly, the demographic groups most similar to Blackfeet are Immigrants from Nicaragua (13.3%, a difference of 0.19%), Yaqui (13.3%, a difference of 0.21%), Sioux (13.2%, a difference of 0.35%), African (13.2%, a difference of 0.37%), and American (13.2%, a difference of 0.39%).
| Demographics | Rating | Rank | Divorced or Separated |
| Chippewa | 0.0 /100 | #305 | Tragic 13.2% |
| Tlingit-Haida | 0.0 /100 | #306 | Tragic 13.2% |
| French American Indians | 0.0 /100 | #307 | Tragic 13.2% |
| Ottawa | 0.0 /100 | #308 | Tragic 13.2% |
| Americans | 0.0 /100 | #309 | Tragic 13.2% |
| Africans | 0.0 /100 | #310 | Tragic 13.2% |
| Sioux | 0.0 /100 | #311 | Tragic 13.2% |
| Blackfeet | 0.0 /100 | #312 | Tragic 13.3% |
| Immigrants | Nicaragua | 0.0 /100 | #313 | Tragic 13.3% |
| Yaqui | 0.0 /100 | #314 | Tragic 13.3% |
| Spanish Americans | 0.0 /100 | #315 | Tragic 13.3% |
| Tsimshian | 0.0 /100 | #316 | Tragic 13.3% |
| Haitians | 0.0 /100 | #317 | Tragic 13.3% |
| Cree | 0.0 /100 | #318 | Tragic 13.4% |
| Puget Sound Salish | 0.0 /100 | #319 | Tragic 13.4% |
| Cajuns | 0.0 /100 | #320 | Tragic 13.4% |
| Cheyenne | 0.0 /100 | #321 | Tragic 13.4% |
| Immigrants | Haiti | 0.0 /100 | #322 | Tragic 13.4% |
| U.S. Virgin Islanders | 0.0 /100 | #323 | Tragic 13.4% |
| Osage | 0.0 /100 | #324 | Tragic 13.4% |
| Potawatomi | 0.0 /100 | #325 | Tragic 13.5% |