Sioux vs Armenian Average Family Size
COMPARE
Sioux
Armenian
Average Family Size
Average Family Size Comparison
Sioux
Armenians
3.52
AVERAGE FAMILY SIZE
100.0/ 100
METRIC RATING
13th/ 347
METRIC RANK
3.25
AVERAGE FAMILY SIZE
78.2/ 100
METRIC RATING
145th/ 347
METRIC RANK
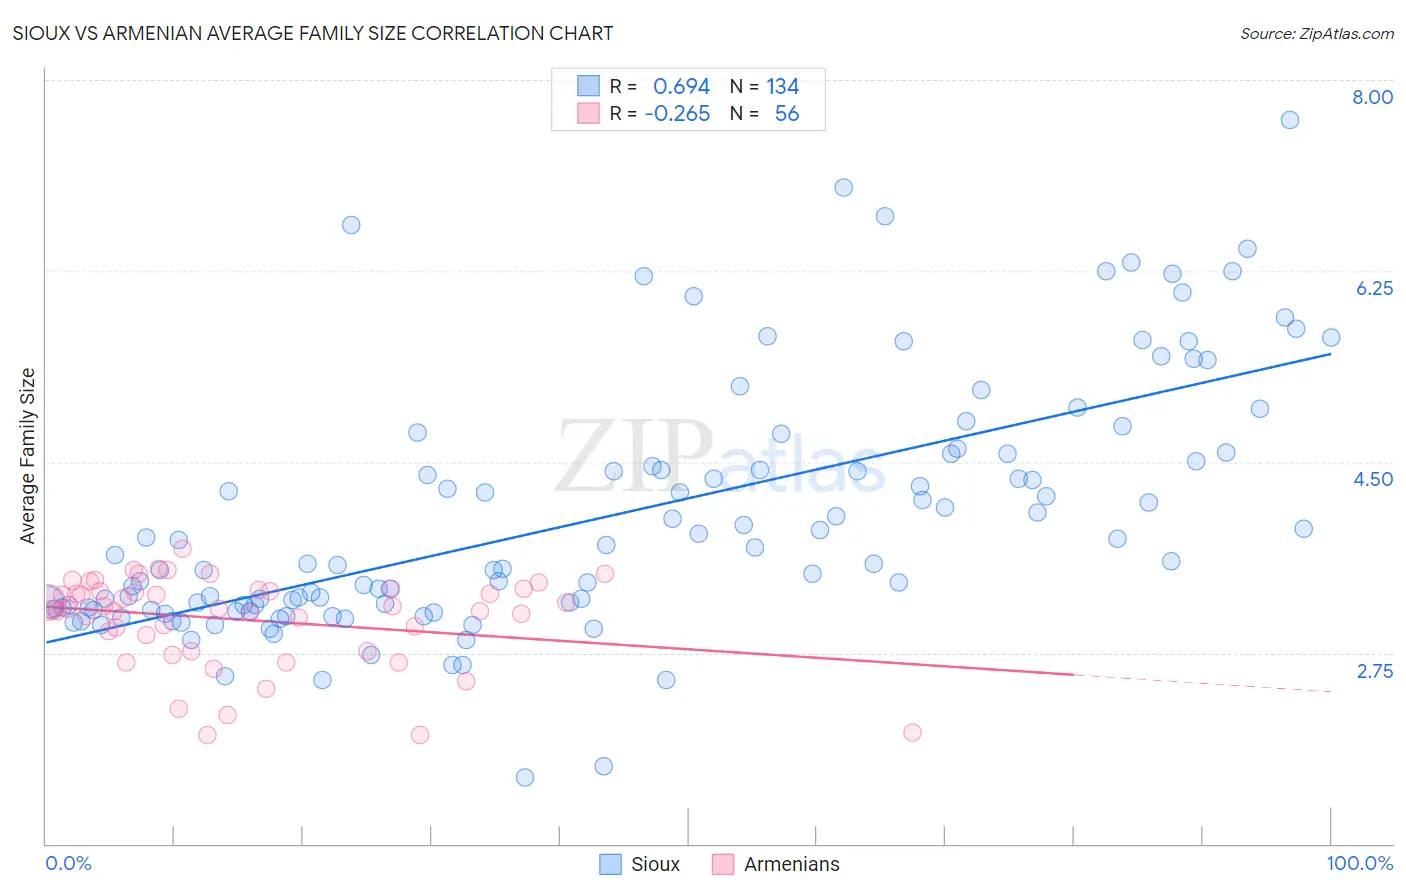
Sioux vs Armenian Average Family Size Correlation Chart
The statistical analysis conducted on geographies consisting of 234,114,463 people shows a significant positive correlation between the proportion of Sioux and average family size in the United States with a correlation coefficient (R) of 0.694 and weighted average of 3.52. Similarly, the statistical analysis conducted on geographies consisting of 310,784,313 people shows a weak negative correlation between the proportion of Armenians and average family size in the United States with a correlation coefficient (R) of -0.265 and weighted average of 3.25, a difference of 8.3%.
Average Family Size Correlation Summary
| Measurement | Sioux | Armenian |
| Minimum | 1.60 | 2.00 |
| Maximum | 7.63 | 3.70 |
| Range | 6.03 | 1.70 |
| Mean | 4.00 | 3.05 |
| Median | 3.58 | 3.16 |
| Interquartile 25% (IQ1) | 3.16 | 2.84 |
| Interquartile 75% (IQ3) | 4.58 | 3.32 |
| Interquartile Range (IQR) | 1.41 | 0.48 |
| Standard Deviation (Sample) | 1.15 | 0.41 |
| Standard Deviation (Population) | 1.14 | 0.41 |
Similar Demographics by Average Family Size
Demographics Similar to Sioux by Average Family Size
In terms of average family size, the demographic groups most similar to Sioux are Immigrants from Mexico (3.52, a difference of 0.080%), Tohono O'odham (3.53, a difference of 0.50%), Immigrants from Central America (3.49, a difference of 0.63%), Tongan (3.49, a difference of 0.68%), and Ute (3.49, a difference of 0.74%).
| Demographics | Rating | Rank | Average Family Size |
| Arapaho | 100.0 /100 | #6 | Exceptional 3.64 |
| Inupiat | 100.0 /100 | #7 | Exceptional 3.63 |
| Immigrants | Yemen | 100.0 /100 | #8 | Exceptional 3.60 |
| Hopi | 100.0 /100 | #9 | Exceptional 3.60 |
| Spanish American Indians | 100.0 /100 | #10 | Exceptional 3.58 |
| Tohono O'odham | 100.0 /100 | #11 | Exceptional 3.53 |
| Immigrants | Mexico | 100.0 /100 | #12 | Exceptional 3.52 |
| Sioux | 100.0 /100 | #13 | Exceptional 3.52 |
| Immigrants | Central America | 100.0 /100 | #14 | Exceptional 3.49 |
| Tongans | 100.0 /100 | #15 | Exceptional 3.49 |
| Ute | 100.0 /100 | #16 | Exceptional 3.49 |
| Immigrants | El Salvador | 100.0 /100 | #17 | Exceptional 3.49 |
| Salvadorans | 100.0 /100 | #18 | Exceptional 3.48 |
| Mexicans | 100.0 /100 | #19 | Exceptional 3.48 |
| Cheyenne | 100.0 /100 | #20 | Exceptional 3.47 |
Demographics Similar to Armenians by Average Family Size
In terms of average family size, the demographic groups most similar to Armenians are Immigrants from Africa (3.25, a difference of 0.010%), Tsimshian (3.25, a difference of 0.050%), Immigrants from Jordan (3.24, a difference of 0.060%), Bhutanese (3.25, a difference of 0.080%), and Blackfeet (3.24, a difference of 0.080%).
| Demographics | Rating | Rank | Average Family Size |
| Cubans | 81.8 /100 | #138 | Excellent 3.25 |
| Immigrants | Ethiopia | 81.6 /100 | #139 | Excellent 3.25 |
| Sub-Saharan Africans | 81.6 /100 | #140 | Excellent 3.25 |
| Venezuelans | 81.4 /100 | #141 | Excellent 3.25 |
| Liberians | 81.2 /100 | #142 | Excellent 3.25 |
| Bhutanese | 81.0 /100 | #143 | Excellent 3.25 |
| Tsimshian | 80.2 /100 | #144 | Excellent 3.25 |
| Armenians | 78.2 /100 | #145 | Good 3.25 |
| Immigrants | Africa | 77.9 /100 | #146 | Good 3.25 |
| Immigrants | Jordan | 75.7 /100 | #147 | Good 3.24 |
| Blackfeet | 75.0 /100 | #148 | Good 3.24 |
| Assyrians/Chaldeans/Syriacs | 73.8 /100 | #149 | Good 3.24 |
| Indians (Asian) | 73.6 /100 | #150 | Good 3.24 |
| Jordanians | 73.5 /100 | #151 | Good 3.24 |
| Spanish Americans | 72.5 /100 | #152 | Good 3.24 |