Mexican vs Vietnamese In Labor Force | Age 16-19
COMPARE
Mexican
Vietnamese
In Labor Force | Age 16-19
In Labor Force | Age 16-19 Comparison
Mexicans
Vietnamese
35.6%
IN LABOR FORCE | AGE 16-19
11.9/ 100
METRIC RATING
211th/ 347
METRIC RANK
29.6%
IN LABOR FORCE | AGE 16-19
0.0/ 100
METRIC RATING
338th/ 347
METRIC RANK
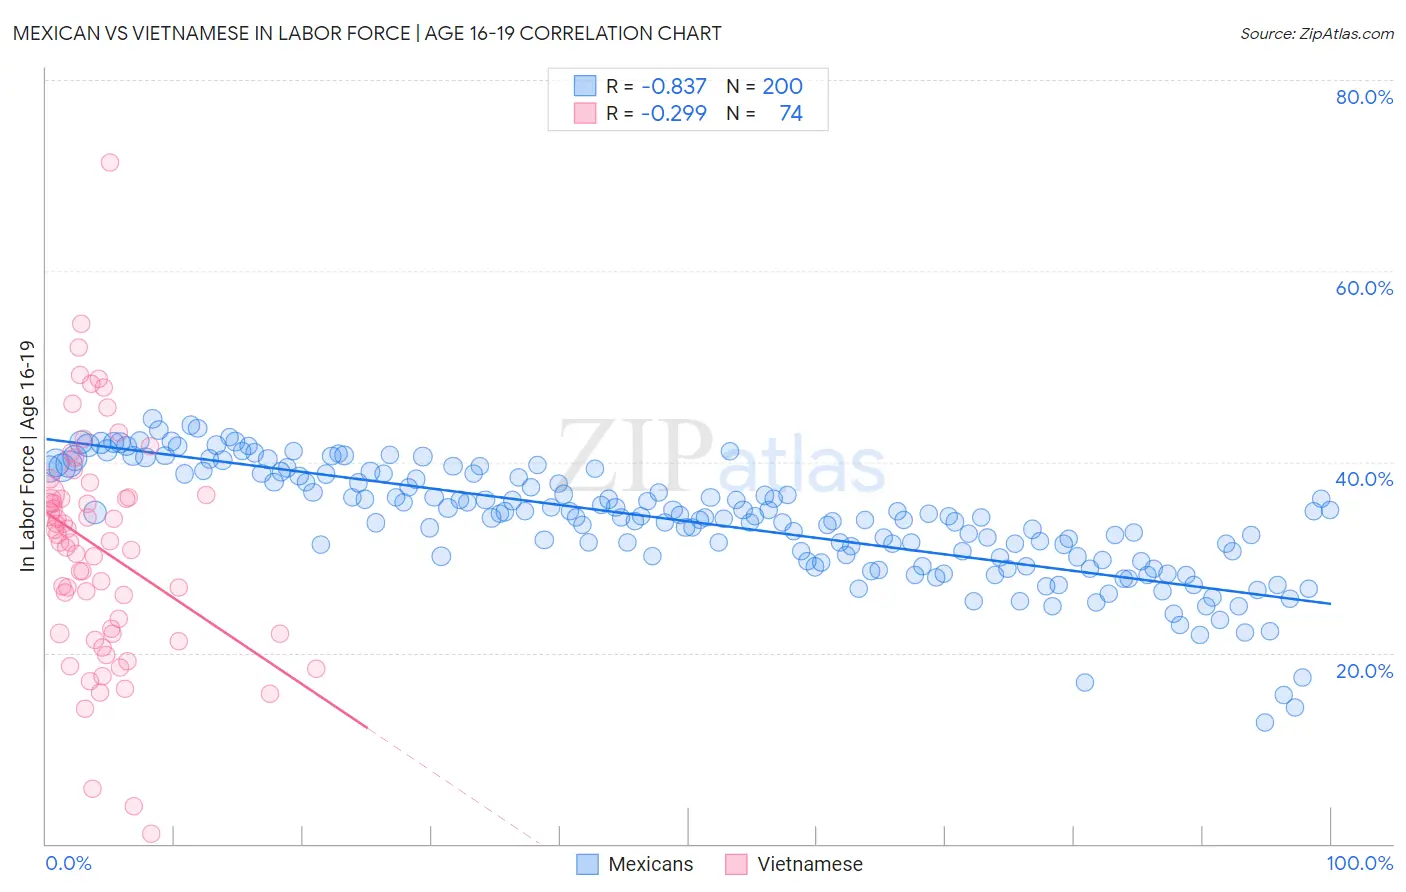
Mexican vs Vietnamese In Labor Force | Age 16-19 Correlation Chart
The statistical analysis conducted on geographies consisting of 561,746,144 people shows a very strong negative correlation between the proportion of Mexicans and labor force participation rate among population between the ages 16 and 19 in the United States with a correlation coefficient (R) of -0.837 and weighted average of 35.6%. Similarly, the statistical analysis conducted on geographies consisting of 170,670,712 people shows a weak negative correlation between the proportion of Vietnamese and labor force participation rate among population between the ages 16 and 19 in the United States with a correlation coefficient (R) of -0.299 and weighted average of 29.6%, a difference of 20.6%.
In Labor Force | Age 16-19 Correlation Summary
| Measurement | Mexican | Vietnamese |
| Minimum | 12.7% | 1.1% |
| Maximum | 44.6% | 71.4% |
| Range | 31.8% | 70.3% |
| Mean | 33.8% | 30.9% |
| Median | 34.3% | 31.6% |
| Interquartile 25% (IQ1) | 30.0% | 22.0% |
| Interquartile 75% (IQ3) | 38.7% | 36.5% |
| Interquartile Range (IQR) | 8.7% | 14.5% |
| Standard Deviation (Sample) | 6.0% | 12.0% |
| Standard Deviation (Population) | 6.0% | 11.9% |
Similar Demographics by In Labor Force | Age 16-19
Demographics Similar to Mexicans by In Labor Force | Age 16-19
In terms of in labor force | age 16-19, the demographic groups most similar to Mexicans are Immigrants from Switzerland (35.6%, a difference of 0.0%), Moroccan (35.7%, a difference of 0.10%), Houma (35.6%, a difference of 0.11%), Immigrants from Bolivia (35.6%, a difference of 0.11%), and Apache (35.6%, a difference of 0.12%).
| Demographics | Rating | Rank | In Labor Force | Age 16-19 |
| Immigrants | Albania | 15.0 /100 | #204 | Poor 35.8% |
| South American Indians | 14.6 /100 | #205 | Poor 35.8% |
| Chileans | 14.6 /100 | #206 | Poor 35.8% |
| Immigrants | Eastern Europe | 14.5 /100 | #207 | Poor 35.8% |
| Koreans | 13.3 /100 | #208 | Poor 35.7% |
| Moroccans | 12.7 /100 | #209 | Poor 35.7% |
| Immigrants | Switzerland | 11.9 /100 | #210 | Poor 35.6% |
| Mexicans | 11.9 /100 | #211 | Poor 35.6% |
| Houma | 11.0 /100 | #212 | Poor 35.6% |
| Immigrants | Bolivia | 11.0 /100 | #213 | Poor 35.6% |
| Apache | 11.0 /100 | #214 | Poor 35.6% |
| Immigrants | South Eastern Asia | 10.8 /100 | #215 | Poor 35.6% |
| Dutch West Indians | 10.7 /100 | #216 | Poor 35.6% |
| Immigrants | Costa Rica | 10.7 /100 | #217 | Poor 35.6% |
| Sri Lankans | 9.8 /100 | #218 | Tragic 35.5% |
Demographics Similar to Vietnamese by In Labor Force | Age 16-19
In terms of in labor force | age 16-19, the demographic groups most similar to Vietnamese are Immigrants from Uzbekistan (29.2%, a difference of 1.4%), British West Indian (29.1%, a difference of 1.6%), Immigrants from Bangladesh (30.0%, a difference of 1.7%), Immigrants from Armenia (29.0%, a difference of 1.8%), and Immigrants from Barbados (29.0%, a difference of 2.0%).
| Demographics | Rating | Rank | In Labor Force | Age 16-19 |
| Trinidadians and Tobagonians | 0.0 /100 | #331 | Tragic 30.9% |
| Immigrants | Israel | 0.0 /100 | #332 | Tragic 30.5% |
| Immigrants | Hong Kong | 0.0 /100 | #333 | Tragic 30.5% |
| Puerto Ricans | 0.0 /100 | #334 | Tragic 30.3% |
| Immigrants | Cuba | 0.0 /100 | #335 | Tragic 30.2% |
| Immigrants | Trinidad and Tobago | 0.0 /100 | #336 | Tragic 30.2% |
| Immigrants | Bangladesh | 0.0 /100 | #337 | Tragic 30.0% |
| Vietnamese | 0.0 /100 | #338 | Tragic 29.6% |
| Immigrants | Uzbekistan | 0.0 /100 | #339 | Tragic 29.2% |
| British West Indians | 0.0 /100 | #340 | Tragic 29.1% |
| Immigrants | Armenia | 0.0 /100 | #341 | Tragic 29.0% |
| Immigrants | Barbados | 0.0 /100 | #342 | Tragic 29.0% |
| Yuman | 0.0 /100 | #343 | Tragic 27.7% |
| Guyanese | 0.0 /100 | #344 | Tragic 27.4% |
| Immigrants | Guyana | 0.0 /100 | #345 | Tragic 27.3% |