Immigrants from Turkey vs Immigrants from Portugal Divorced or Separated
COMPARE
Immigrants from Turkey
Immigrants from Portugal
Divorced or Separated
Divorced or Separated Comparison
Immigrants from Turkey
Immigrants from Portugal
11.2%
DIVORCED OR SEPARATED
100.0/ 100
METRIC RATING
48th/ 347
METRIC RANK
11.9%
DIVORCED OR SEPARATED
77.3/ 100
METRIC RATING
150th/ 347
METRIC RANK
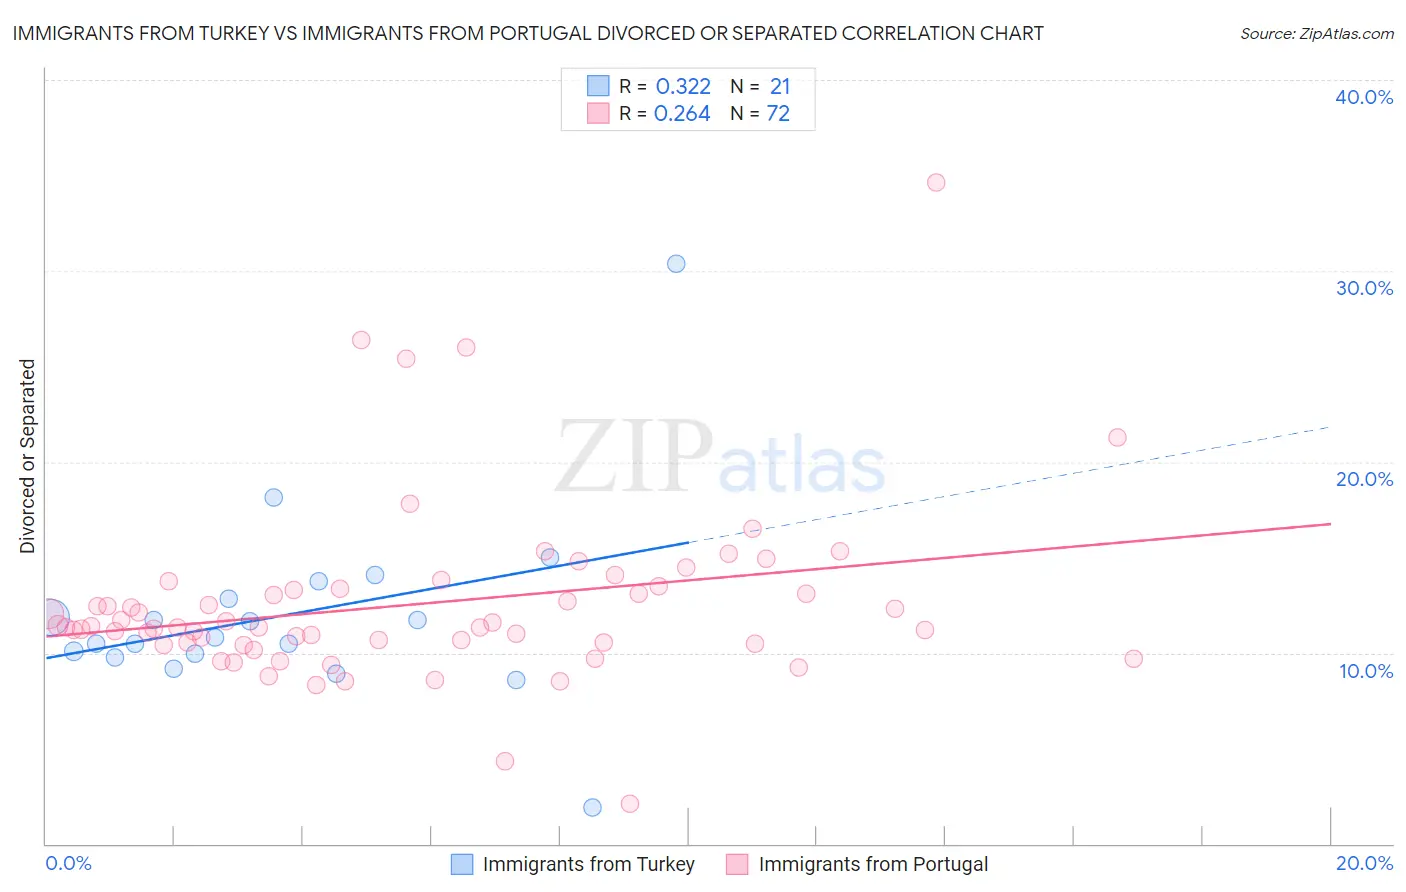
Immigrants from Turkey vs Immigrants from Portugal Divorced or Separated Correlation Chart
The statistical analysis conducted on geographies consisting of 222,988,448 people shows a mild positive correlation between the proportion of Immigrants from Turkey and percentage of population currently divorced or separated in the United States with a correlation coefficient (R) of 0.322 and weighted average of 11.2%. Similarly, the statistical analysis conducted on geographies consisting of 174,784,799 people shows a weak positive correlation between the proportion of Immigrants from Portugal and percentage of population currently divorced or separated in the United States with a correlation coefficient (R) of 0.264 and weighted average of 11.9%, a difference of 6.4%.
Divorced or Separated Correlation Summary
| Measurement | Immigrants from Turkey | Immigrants from Portugal |
| Minimum | 1.9% | 2.1% |
| Maximum | 30.4% | 34.6% |
| Range | 28.5% | 32.5% |
| Mean | 12.0% | 12.5% |
| Median | 10.8% | 11.3% |
| Interquartile 25% (IQ1) | 9.9% | 10.5% |
| Interquartile 75% (IQ3) | 13.3% | 13.3% |
| Interquartile Range (IQR) | 3.4% | 2.8% |
| Standard Deviation (Sample) | 5.2% | 4.7% |
| Standard Deviation (Population) | 5.1% | 4.7% |
Similar Demographics by Divorced or Separated
Demographics Similar to Immigrants from Turkey by Divorced or Separated
In terms of divorced or separated, the demographic groups most similar to Immigrants from Turkey are Immigrants from Saudi Arabia (11.2%, a difference of 0.010%), Immigrants from Poland (11.2%, a difference of 0.030%), Laotian (11.2%, a difference of 0.040%), Bolivian (11.2%, a difference of 0.080%), and Turkish (11.2%, a difference of 0.15%).
| Demographics | Rating | Rank | Divorced or Separated |
| Bhutanese | 100.0 /100 | #41 | Exceptional 11.2% |
| Chinese | 100.0 /100 | #42 | Exceptional 11.2% |
| Immigrants | Belarus | 100.0 /100 | #43 | Exceptional 11.2% |
| Immigrants | Western Asia | 100.0 /100 | #44 | Exceptional 11.2% |
| Turks | 100.0 /100 | #45 | Exceptional 11.2% |
| Laotians | 100.0 /100 | #46 | Exceptional 11.2% |
| Immigrants | Poland | 100.0 /100 | #47 | Exceptional 11.2% |
| Immigrants | Turkey | 100.0 /100 | #48 | Exceptional 11.2% |
| Immigrants | Saudi Arabia | 100.0 /100 | #49 | Exceptional 11.2% |
| Bolivians | 100.0 /100 | #50 | Exceptional 11.2% |
| Immigrants | Bolivia | 100.0 /100 | #51 | Exceptional 11.3% |
| Immigrants | Australia | 99.9 /100 | #52 | Exceptional 11.3% |
| Immigrants | Lithuania | 99.9 /100 | #53 | Exceptional 11.3% |
| Eastern Europeans | 99.9 /100 | #54 | Exceptional 11.3% |
| Immigrants | Yemen | 99.9 /100 | #55 | Exceptional 11.3% |
Demographics Similar to Immigrants from Portugal by Divorced or Separated
In terms of divorced or separated, the demographic groups most similar to Immigrants from Portugal are Immigrants from Oceania (11.9%, a difference of 0.020%), Italian (11.9%, a difference of 0.030%), Czech (11.9%, a difference of 0.040%), Polish (11.9%, a difference of 0.070%), and Immigrants from Grenada (11.9%, a difference of 0.090%).
| Demographics | Rating | Rank | Divorced or Separated |
| Pakistanis | 81.3 /100 | #143 | Excellent 11.9% |
| Peruvians | 80.9 /100 | #144 | Excellent 11.9% |
| Croatians | 80.6 /100 | #145 | Excellent 11.9% |
| Immigrants | Grenada | 79.1 /100 | #146 | Good 11.9% |
| Poles | 78.6 /100 | #147 | Good 11.9% |
| Italians | 77.8 /100 | #148 | Good 11.9% |
| Immigrants | Oceania | 77.7 /100 | #149 | Good 11.9% |
| Immigrants | Portugal | 77.3 /100 | #150 | Good 11.9% |
| Czechs | 76.4 /100 | #151 | Good 11.9% |
| Immigrants | Hungary | 73.7 /100 | #152 | Good 11.9% |
| Austrians | 72.2 /100 | #153 | Good 12.0% |
| Chileans | 71.3 /100 | #154 | Good 12.0% |
| Japanese | 70.9 /100 | #155 | Good 12.0% |
| Hungarians | 70.3 /100 | #156 | Good 12.0% |
| Immigrants | Brazil | 68.8 /100 | #157 | Good 12.0% |