Mexican American Indian vs Immigrants from Vietnam Family Households
COMPARE
Mexican American Indian
Immigrants from Vietnam
Family Households
Family Households Comparison
Mexican American Indians
Immigrants from Vietnam
67.0%
FAMILY HOUSEHOLDS
100.0/ 100
METRIC RATING
38th/ 347
METRIC RANK
68.2%
FAMILY HOUSEHOLDS
100.0/ 100
METRIC RATING
16th/ 347
METRIC RANK
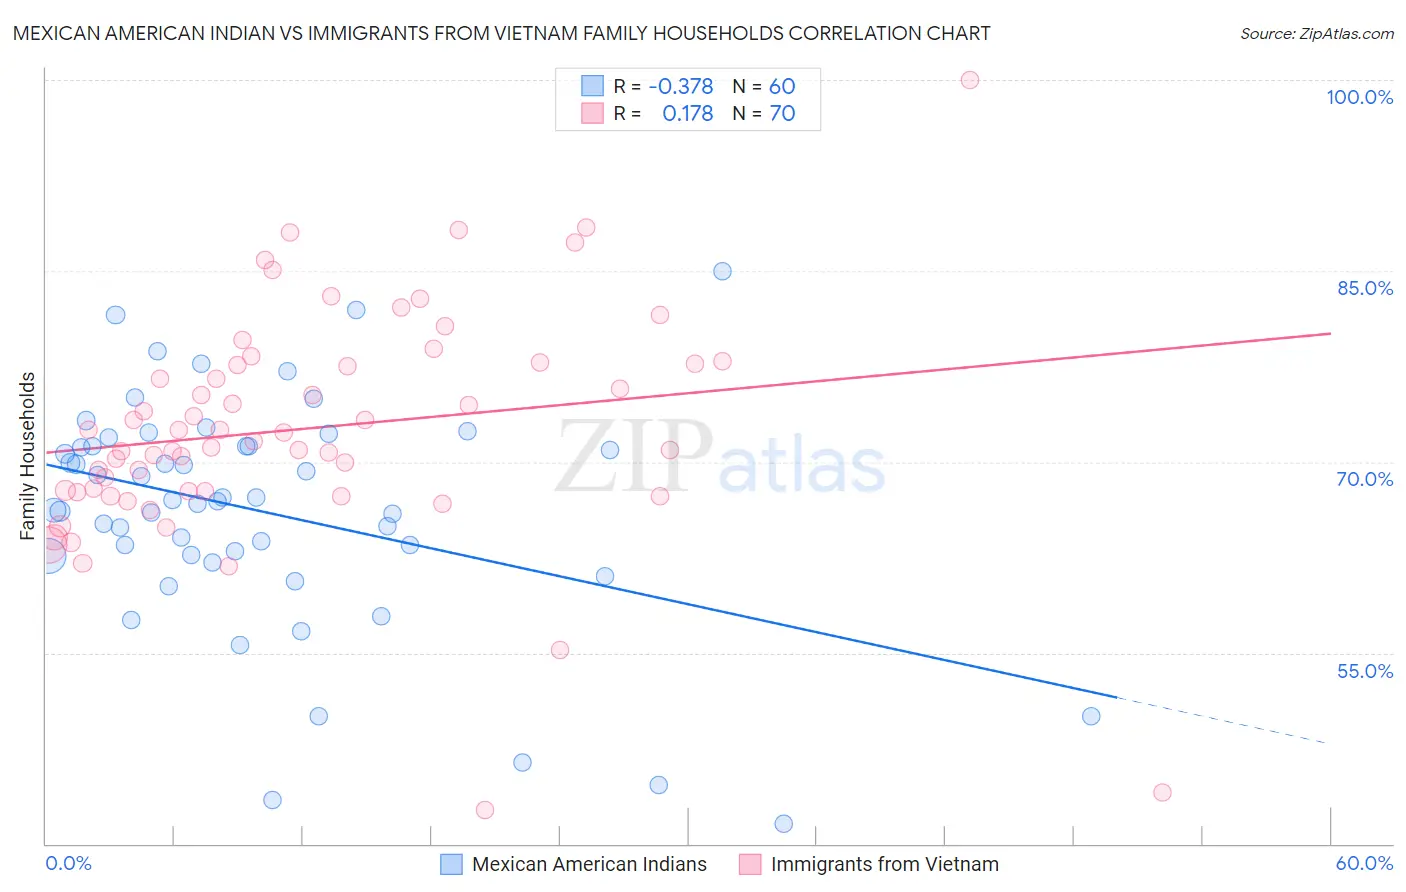
Mexican American Indian vs Immigrants from Vietnam Family Households Correlation Chart
The statistical analysis conducted on geographies consisting of 317,495,580 people shows a mild negative correlation between the proportion of Mexican American Indians and percentage of family households in the United States with a correlation coefficient (R) of -0.378 and weighted average of 67.0%. Similarly, the statistical analysis conducted on geographies consisting of 404,558,731 people shows a poor positive correlation between the proportion of Immigrants from Vietnam and percentage of family households in the United States with a correlation coefficient (R) of 0.178 and weighted average of 68.2%, a difference of 1.7%.
Family Households Correlation Summary
| Measurement | Mexican American Indian | Immigrants from Vietnam |
| Minimum | 41.6% | 42.7% |
| Maximum | 85.0% | 100.0% |
| Range | 43.4% | 57.3% |
| Mean | 66.1% | 72.6% |
| Median | 67.0% | 72.0% |
| Interquartile 25% (IQ1) | 62.6% | 67.7% |
| Interquartile 75% (IQ3) | 71.3% | 77.7% |
| Interquartile Range (IQR) | 8.6% | 10.0% |
| Standard Deviation (Sample) | 9.1% | 9.2% |
| Standard Deviation (Population) | 9.0% | 9.1% |
Similar Demographics by Family Households
Demographics Similar to Mexican American Indians by Family Households
In terms of family households, the demographic groups most similar to Mexican American Indians are Immigrants from El Salvador (67.0%, a difference of 0.020%), Tsimshian (67.1%, a difference of 0.10%), Peruvian (67.1%, a difference of 0.17%), Tohono O'odham (67.1%, a difference of 0.18%), and Salvadoran (67.2%, a difference of 0.23%).
| Demographics | Rating | Rank | Family Households |
| Immigrants | Latin America | 100.0 /100 | #31 | Exceptional 67.2% |
| Nepalese | 100.0 /100 | #32 | Exceptional 67.2% |
| Salvadorans | 100.0 /100 | #33 | Exceptional 67.2% |
| Thais | 100.0 /100 | #34 | Exceptional 67.2% |
| Tohono O'odham | 100.0 /100 | #35 | Exceptional 67.1% |
| Peruvians | 100.0 /100 | #36 | Exceptional 67.1% |
| Tsimshian | 100.0 /100 | #37 | Exceptional 67.1% |
| Mexican American Indians | 100.0 /100 | #38 | Exceptional 67.0% |
| Immigrants | El Salvador | 100.0 /100 | #39 | Exceptional 67.0% |
| Guamanians/Chamorros | 100.0 /100 | #40 | Exceptional 66.6% |
| Immigrants | Bolivia | 100.0 /100 | #41 | Exceptional 66.6% |
| Menominee | 100.0 /100 | #42 | Exceptional 66.5% |
| Apache | 100.0 /100 | #43 | Exceptional 66.5% |
| Asians | 100.0 /100 | #44 | Exceptional 66.5% |
| Venezuelans | 100.0 /100 | #45 | Exceptional 66.5% |
Demographics Similar to Immigrants from Vietnam by Family Households
In terms of family households, the demographic groups most similar to Immigrants from Vietnam are Assyrian/Chaldean/Syriac (68.2%, a difference of 0.0%), Chinese (68.1%, a difference of 0.030%), Immigrants from Cuba (68.2%, a difference of 0.060%), Pueblo (68.2%, a difference of 0.070%), and Korean (68.3%, a difference of 0.15%).
| Demographics | Rating | Rank | Family Households |
| Native Hawaiians | 100.0 /100 | #9 | Exceptional 68.4% |
| Immigrants | Philippines | 100.0 /100 | #10 | Exceptional 68.3% |
| Immigrants | Central America | 100.0 /100 | #11 | Exceptional 68.3% |
| Koreans | 100.0 /100 | #12 | Exceptional 68.3% |
| Pueblo | 100.0 /100 | #13 | Exceptional 68.2% |
| Immigrants | Cuba | 100.0 /100 | #14 | Exceptional 68.2% |
| Assyrians/Chaldeans/Syriacs | 100.0 /100 | #15 | Exceptional 68.2% |
| Immigrants | Vietnam | 100.0 /100 | #16 | Exceptional 68.2% |
| Chinese | 100.0 /100 | #17 | Exceptional 68.1% |
| Immigrants | Taiwan | 100.0 /100 | #18 | Exceptional 68.0% |
| Samoans | 100.0 /100 | #19 | Exceptional 67.9% |
| Inupiat | 100.0 /100 | #20 | Exceptional 67.8% |
| Cubans | 100.0 /100 | #21 | Exceptional 67.7% |
| Sri Lankans | 100.0 /100 | #22 | Exceptional 67.7% |
| Immigrants | Pakistan | 100.0 /100 | #23 | Exceptional 67.7% |