Menominee vs Norwegian Divorced or Separated
COMPARE
Menominee
Norwegian
Divorced or Separated
Divorced or Separated Comparison
Menominee
Norwegians
11.8%
DIVORCED OR SEPARATED
93.8/ 100
METRIC RATING
122nd/ 347
METRIC RANK
12.1%
DIVORCED OR SEPARATED
33.2/ 100
METRIC RATING
192nd/ 347
METRIC RANK
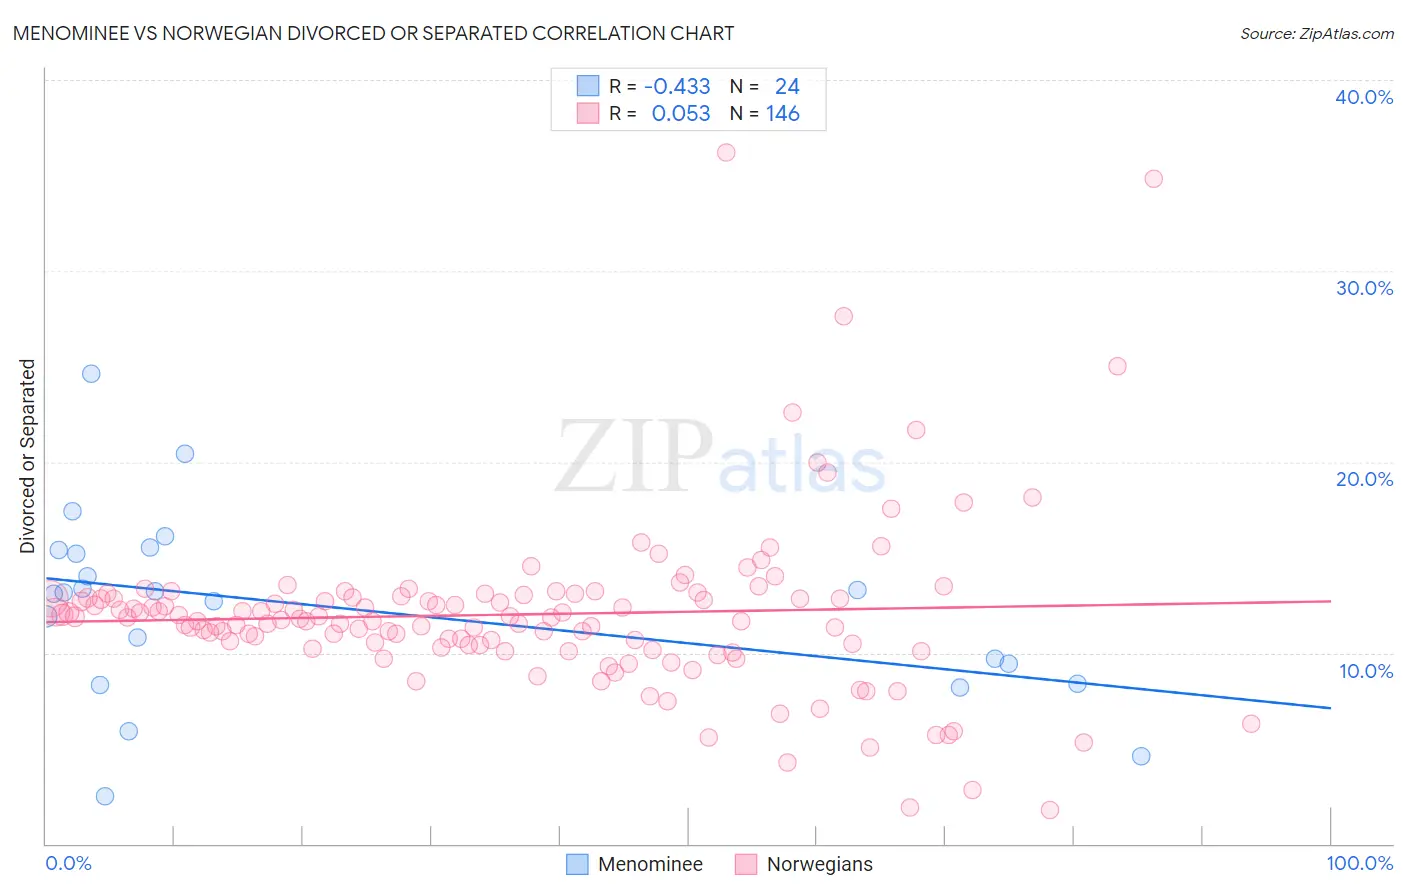
Menominee vs Norwegian Divorced or Separated Correlation Chart
The statistical analysis conducted on geographies consisting of 45,778,710 people shows a moderate negative correlation between the proportion of Menominee and percentage of population currently divorced or separated in the United States with a correlation coefficient (R) of -0.433 and weighted average of 11.8%. Similarly, the statistical analysis conducted on geographies consisting of 533,039,037 people shows a slight positive correlation between the proportion of Norwegians and percentage of population currently divorced or separated in the United States with a correlation coefficient (R) of 0.053 and weighted average of 12.1%, a difference of 3.0%.
Divorced or Separated Correlation Summary
| Measurement | Menominee | Norwegian |
| Minimum | 2.5% | 1.8% |
| Maximum | 24.6% | 36.2% |
| Range | 22.1% | 34.4% |
| Mean | 12.4% | 12.0% |
| Median | 13.1% | 11.8% |
| Interquartile 25% (IQ1) | 8.9% | 10.4% |
| Interquartile 75% (IQ3) | 15.3% | 12.9% |
| Interquartile Range (IQR) | 6.4% | 2.5% |
| Standard Deviation (Sample) | 4.9% | 4.5% |
| Standard Deviation (Population) | 4.8% | 4.5% |
Similar Demographics by Divorced or Separated
Demographics Similar to Menominee by Divorced or Separated
In terms of divorced or separated, the demographic groups most similar to Menominee are Immigrants (11.8%, a difference of 0.020%), Ugandan (11.8%, a difference of 0.090%), Romanian (11.8%, a difference of 0.12%), Iraqi (11.8%, a difference of 0.13%), and Ukrainian (11.8%, a difference of 0.20%).
| Demographics | Rating | Rank | Divorced or Separated |
| Lithuanians | 95.7 /100 | #115 | Exceptional 11.7% |
| Immigrants | Iraq | 95.4 /100 | #116 | Exceptional 11.7% |
| Immigrants | Uganda | 95.3 /100 | #117 | Exceptional 11.7% |
| Ecuadorians | 95.3 /100 | #118 | Exceptional 11.7% |
| Syrians | 95.1 /100 | #119 | Exceptional 11.7% |
| Iraqis | 94.6 /100 | #120 | Exceptional 11.8% |
| Romanians | 94.5 /100 | #121 | Exceptional 11.8% |
| Menominee | 93.8 /100 | #122 | Exceptional 11.8% |
| Immigrants | Immigrants | 93.7 /100 | #123 | Exceptional 11.8% |
| Ugandans | 93.1 /100 | #124 | Exceptional 11.8% |
| Ukrainians | 92.3 /100 | #125 | Exceptional 11.8% |
| South American Indians | 92.1 /100 | #126 | Exceptional 11.8% |
| South Africans | 88.9 /100 | #127 | Excellent 11.8% |
| Immigrants | Ecuador | 88.9 /100 | #128 | Excellent 11.8% |
| Immigrants | St. Vincent and the Grenadines | 88.4 /100 | #129 | Excellent 11.8% |
Demographics Similar to Norwegians by Divorced or Separated
In terms of divorced or separated, the demographic groups most similar to Norwegians are Immigrants from Thailand (12.1%, a difference of 0.030%), Swedish (12.1%, a difference of 0.050%), Immigrants from Eritrea (12.1%, a difference of 0.050%), Moroccan (12.1%, a difference of 0.060%), and Immigrants from England (12.1%, a difference of 0.070%).
| Demographics | Rating | Rank | Divorced or Separated |
| Immigrants | Nigeria | 40.5 /100 | #185 | Average 12.1% |
| Immigrants | Chile | 39.0 /100 | #186 | Fair 12.1% |
| Belizeans | 37.7 /100 | #187 | Fair 12.1% |
| Immigrants | Belize | 37.6 /100 | #188 | Fair 12.1% |
| Sierra Leoneans | 35.5 /100 | #189 | Fair 12.1% |
| Moroccans | 34.8 /100 | #190 | Fair 12.1% |
| Swedes | 34.4 /100 | #191 | Fair 12.1% |
| Norwegians | 33.2 /100 | #192 | Fair 12.1% |
| Immigrants | Thailand | 32.5 /100 | #193 | Fair 12.1% |
| Immigrants | Eritrea | 31.9 /100 | #194 | Fair 12.1% |
| Immigrants | England | 31.4 /100 | #195 | Fair 12.1% |
| Immigrants | Burma/Myanmar | 30.4 /100 | #196 | Fair 12.1% |
| Immigrants | Africa | 30.3 /100 | #197 | Fair 12.1% |
| Nigerians | 30.1 /100 | #198 | Fair 12.1% |
| Central Americans | 29.4 /100 | #199 | Fair 12.1% |