Immigrants from St. Vincent and the Grenadines vs Norwegian Divorced or Separated
COMPARE
Immigrants from St. Vincent and the Grenadines
Norwegian
Divorced or Separated
Divorced or Separated Comparison
Immigrants from St. Vincent and the Grenadines
Norwegians
11.8%
DIVORCED OR SEPARATED
88.4/ 100
METRIC RATING
129th/ 347
METRIC RANK
12.1%
DIVORCED OR SEPARATED
33.2/ 100
METRIC RATING
192nd/ 347
METRIC RANK
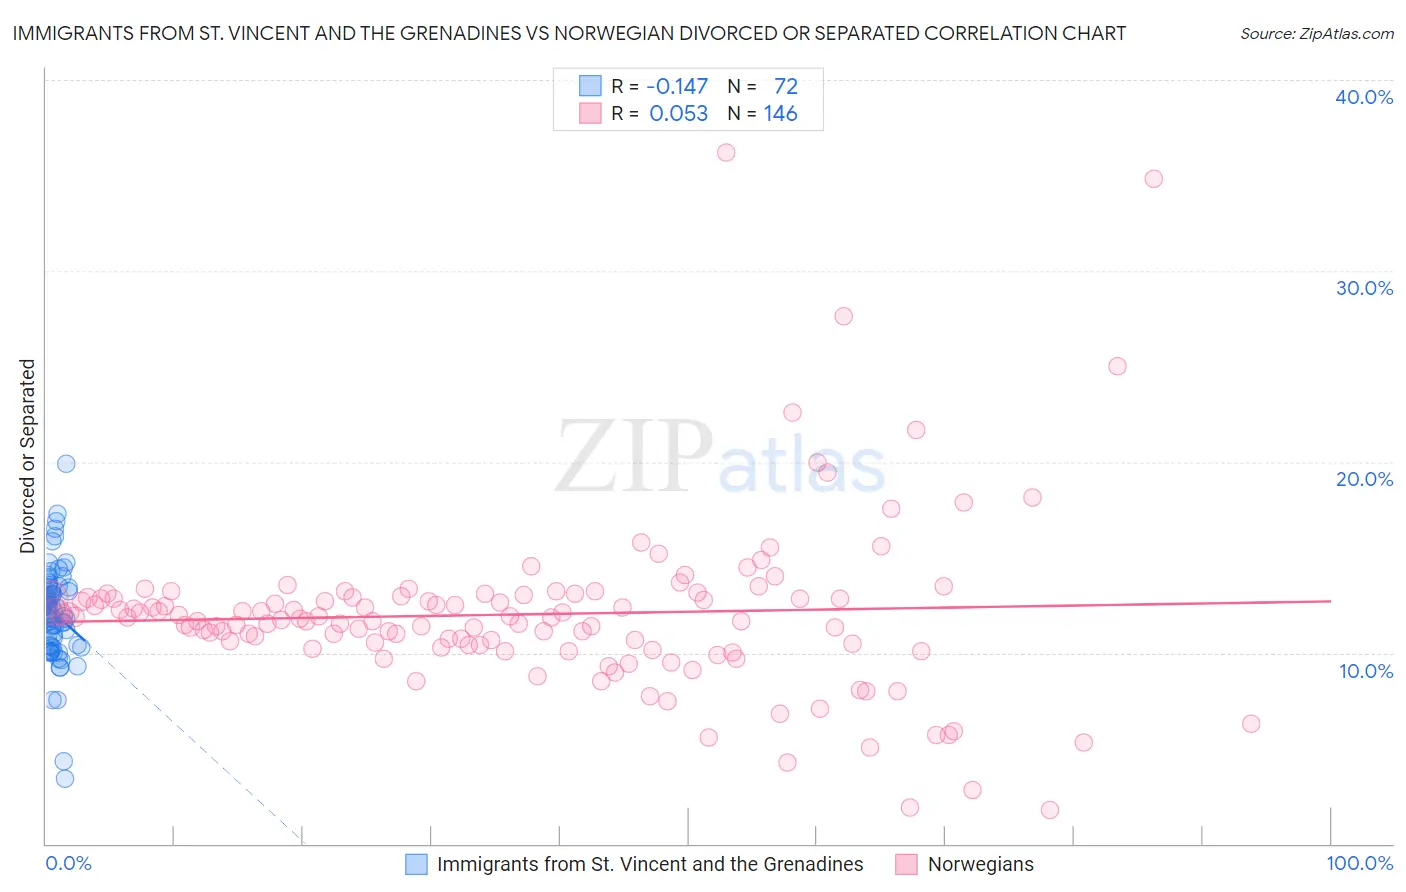
Immigrants from St. Vincent and the Grenadines vs Norwegian Divorced or Separated Correlation Chart
The statistical analysis conducted on geographies consisting of 56,190,890 people shows a poor negative correlation between the proportion of Immigrants from St. Vincent and the Grenadines and percentage of population currently divorced or separated in the United States with a correlation coefficient (R) of -0.147 and weighted average of 11.8%. Similarly, the statistical analysis conducted on geographies consisting of 533,039,037 people shows a slight positive correlation between the proportion of Norwegians and percentage of population currently divorced or separated in the United States with a correlation coefficient (R) of 0.053 and weighted average of 12.1%, a difference of 2.4%.
Divorced or Separated Correlation Summary
| Measurement | Immigrants from St. Vincent and the Grenadines | Norwegian |
| Minimum | 3.4% | 1.8% |
| Maximum | 19.9% | 36.2% |
| Range | 16.5% | 34.4% |
| Mean | 12.0% | 12.0% |
| Median | 12.1% | 11.8% |
| Interquartile 25% (IQ1) | 10.4% | 10.4% |
| Interquartile 75% (IQ3) | 13.4% | 12.9% |
| Interquartile Range (IQR) | 3.0% | 2.5% |
| Standard Deviation (Sample) | 2.6% | 4.5% |
| Standard Deviation (Population) | 2.6% | 4.5% |
Similar Demographics by Divorced or Separated
Demographics Similar to Immigrants from St. Vincent and the Grenadines by Divorced or Separated
In terms of divorced or separated, the demographic groups most similar to Immigrants from St. Vincent and the Grenadines are Immigrants from Austria (11.8%, a difference of 0.010%), Immigrants from Cambodia (11.8%, a difference of 0.020%), South African (11.8%, a difference of 0.040%), Immigrants from Ecuador (11.8%, a difference of 0.040%), and Immigrants from Afghanistan (11.8%, a difference of 0.040%).
| Demographics | Rating | Rank | Divorced or Separated |
| Menominee | 93.8 /100 | #122 | Exceptional 11.8% |
| Immigrants | Immigrants | 93.7 /100 | #123 | Exceptional 11.8% |
| Ugandans | 93.1 /100 | #124 | Exceptional 11.8% |
| Ukrainians | 92.3 /100 | #125 | Exceptional 11.8% |
| South American Indians | 92.1 /100 | #126 | Exceptional 11.8% |
| South Africans | 88.9 /100 | #127 | Excellent 11.8% |
| Immigrants | Ecuador | 88.9 /100 | #128 | Excellent 11.8% |
| Immigrants | St. Vincent and the Grenadines | 88.4 /100 | #129 | Excellent 11.8% |
| Immigrants | Austria | 88.2 /100 | #130 | Excellent 11.8% |
| Immigrants | Cambodia | 88.2 /100 | #131 | Excellent 11.8% |
| Immigrants | Afghanistan | 87.9 /100 | #132 | Excellent 11.8% |
| New Zealanders | 87.5 /100 | #133 | Excellent 11.9% |
| Argentineans | 85.1 /100 | #134 | Excellent 11.9% |
| Danes | 84.8 /100 | #135 | Excellent 11.9% |
| Carpatho Rusyns | 84.8 /100 | #136 | Excellent 11.9% |
Demographics Similar to Norwegians by Divorced or Separated
In terms of divorced or separated, the demographic groups most similar to Norwegians are Immigrants from Thailand (12.1%, a difference of 0.030%), Swedish (12.1%, a difference of 0.050%), Immigrants from Eritrea (12.1%, a difference of 0.050%), Moroccan (12.1%, a difference of 0.060%), and Immigrants from England (12.1%, a difference of 0.070%).
| Demographics | Rating | Rank | Divorced or Separated |
| Immigrants | Nigeria | 40.5 /100 | #185 | Average 12.1% |
| Immigrants | Chile | 39.0 /100 | #186 | Fair 12.1% |
| Belizeans | 37.7 /100 | #187 | Fair 12.1% |
| Immigrants | Belize | 37.6 /100 | #188 | Fair 12.1% |
| Sierra Leoneans | 35.5 /100 | #189 | Fair 12.1% |
| Moroccans | 34.8 /100 | #190 | Fair 12.1% |
| Swedes | 34.4 /100 | #191 | Fair 12.1% |
| Norwegians | 33.2 /100 | #192 | Fair 12.1% |
| Immigrants | Thailand | 32.5 /100 | #193 | Fair 12.1% |
| Immigrants | Eritrea | 31.9 /100 | #194 | Fair 12.1% |
| Immigrants | England | 31.4 /100 | #195 | Fair 12.1% |
| Immigrants | Burma/Myanmar | 30.4 /100 | #196 | Fair 12.1% |
| Immigrants | Africa | 30.3 /100 | #197 | Fair 12.1% |
| Nigerians | 30.1 /100 | #198 | Fair 12.1% |
| Central Americans | 29.4 /100 | #199 | Fair 12.1% |