Menominee vs Mongolian Divorced or Separated
COMPARE
Menominee
Mongolian
Divorced or Separated
Divorced or Separated Comparison
Menominee
Mongolians
11.8%
DIVORCED OR SEPARATED
93.8/ 100
METRIC RATING
122nd/ 347
METRIC RANK
11.1%
DIVORCED OR SEPARATED
100.0/ 100
METRIC RATING
31st/ 347
METRIC RANK
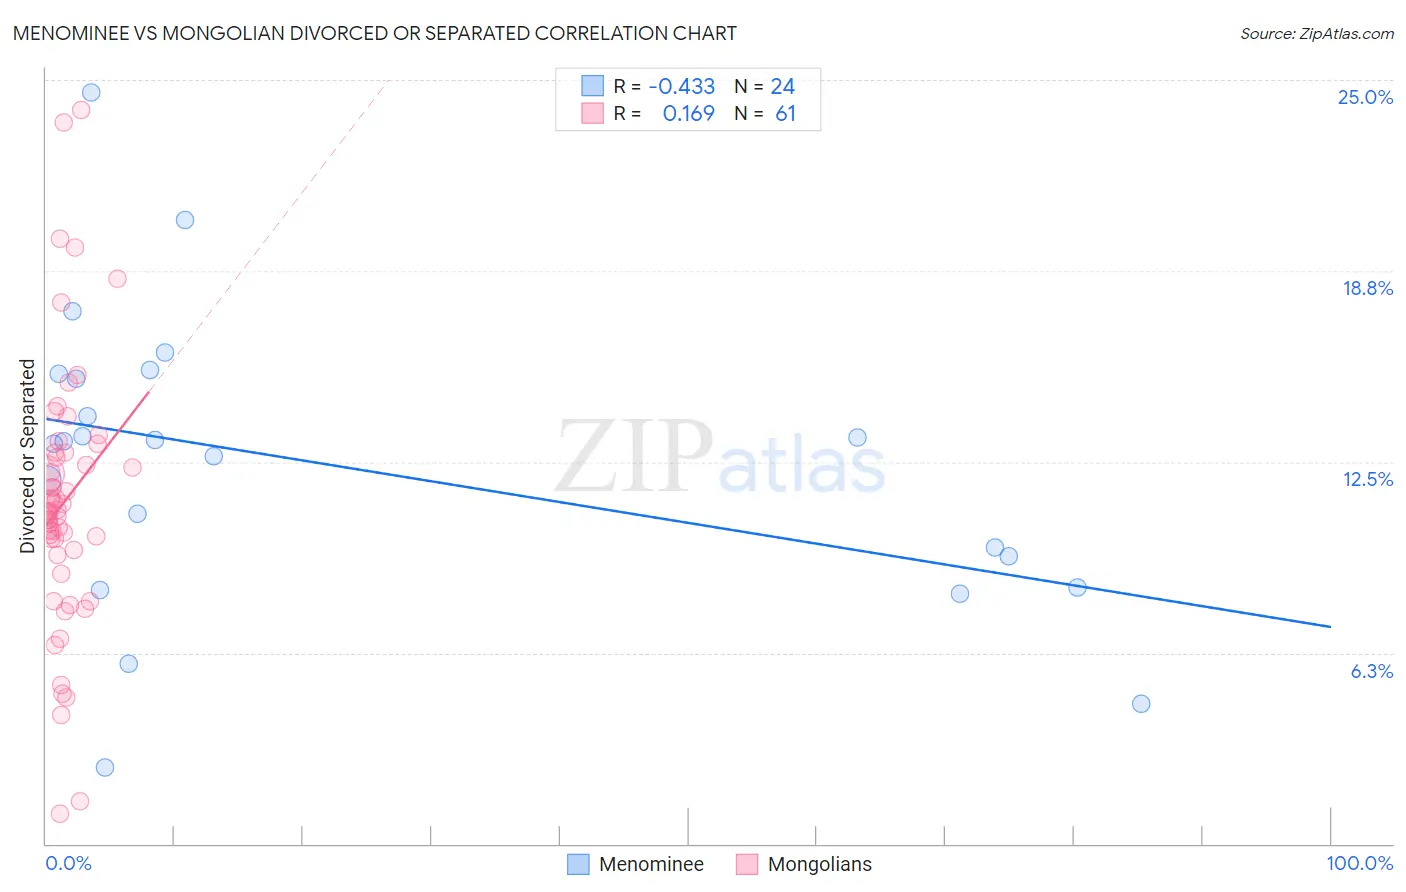
Menominee vs Mongolian Divorced or Separated Correlation Chart
The statistical analysis conducted on geographies consisting of 45,778,710 people shows a moderate negative correlation between the proportion of Menominee and percentage of population currently divorced or separated in the United States with a correlation coefficient (R) of -0.433 and weighted average of 11.8%. Similarly, the statistical analysis conducted on geographies consisting of 140,326,151 people shows a poor positive correlation between the proportion of Mongolians and percentage of population currently divorced or separated in the United States with a correlation coefficient (R) of 0.169 and weighted average of 11.1%, a difference of 6.4%.
Divorced or Separated Correlation Summary
| Measurement | Menominee | Mongolian |
| Minimum | 2.5% | 1.0% |
| Maximum | 24.6% | 24.0% |
| Range | 22.1% | 23.0% |
| Mean | 12.4% | 11.2% |
| Median | 13.1% | 10.9% |
| Interquartile 25% (IQ1) | 8.9% | 9.5% |
| Interquartile 75% (IQ3) | 15.3% | 12.8% |
| Interquartile Range (IQR) | 6.4% | 3.3% |
| Standard Deviation (Sample) | 4.9% | 4.3% |
| Standard Deviation (Population) | 4.8% | 4.3% |
Similar Demographics by Divorced or Separated
Demographics Similar to Menominee by Divorced or Separated
In terms of divorced or separated, the demographic groups most similar to Menominee are Immigrants (11.8%, a difference of 0.020%), Ugandan (11.8%, a difference of 0.090%), Romanian (11.8%, a difference of 0.12%), Iraqi (11.8%, a difference of 0.13%), and Ukrainian (11.8%, a difference of 0.20%).
| Demographics | Rating | Rank | Divorced or Separated |
| Lithuanians | 95.7 /100 | #115 | Exceptional 11.7% |
| Immigrants | Iraq | 95.4 /100 | #116 | Exceptional 11.7% |
| Immigrants | Uganda | 95.3 /100 | #117 | Exceptional 11.7% |
| Ecuadorians | 95.3 /100 | #118 | Exceptional 11.7% |
| Syrians | 95.1 /100 | #119 | Exceptional 11.7% |
| Iraqis | 94.6 /100 | #120 | Exceptional 11.8% |
| Romanians | 94.5 /100 | #121 | Exceptional 11.8% |
| Menominee | 93.8 /100 | #122 | Exceptional 11.8% |
| Immigrants | Immigrants | 93.7 /100 | #123 | Exceptional 11.8% |
| Ugandans | 93.1 /100 | #124 | Exceptional 11.8% |
| Ukrainians | 92.3 /100 | #125 | Exceptional 11.8% |
| South American Indians | 92.1 /100 | #126 | Exceptional 11.8% |
| South Africans | 88.9 /100 | #127 | Excellent 11.8% |
| Immigrants | Ecuador | 88.9 /100 | #128 | Excellent 11.8% |
| Immigrants | St. Vincent and the Grenadines | 88.4 /100 | #129 | Excellent 11.8% |
Demographics Similar to Mongolians by Divorced or Separated
In terms of divorced or separated, the demographic groups most similar to Mongolians are Tongan (11.1%, a difference of 0.080%), Egyptian (11.1%, a difference of 0.12%), Immigrants from Uzbekistan (11.1%, a difference of 0.19%), Cambodian (11.1%, a difference of 0.27%), and Immigrants from Ireland (11.0%, a difference of 0.30%).
| Demographics | Rating | Rank | Divorced or Separated |
| Immigrants | Sri Lanka | 100.0 /100 | #24 | Exceptional 10.8% |
| Iranians | 100.0 /100 | #25 | Exceptional 10.8% |
| Immigrants | Indonesia | 100.0 /100 | #26 | Exceptional 10.9% |
| Immigrants | Bangladesh | 100.0 /100 | #27 | Exceptional 11.0% |
| Immigrants | Malaysia | 100.0 /100 | #28 | Exceptional 11.0% |
| Armenians | 100.0 /100 | #29 | Exceptional 11.0% |
| Immigrants | Ireland | 100.0 /100 | #30 | Exceptional 11.0% |
| Mongolians | 100.0 /100 | #31 | Exceptional 11.1% |
| Tongans | 100.0 /100 | #32 | Exceptional 11.1% |
| Egyptians | 100.0 /100 | #33 | Exceptional 11.1% |
| Immigrants | Uzbekistan | 100.0 /100 | #34 | Exceptional 11.1% |
| Cambodians | 100.0 /100 | #35 | Exceptional 11.1% |
| Immigrants | Japan | 100.0 /100 | #36 | Exceptional 11.1% |
| Immigrants | Lebanon | 100.0 /100 | #37 | Exceptional 11.1% |
| Immigrants | Greece | 100.0 /100 | #38 | Exceptional 11.1% |