Menominee vs German Russian Divorced or Separated
COMPARE
Menominee
German Russian
Divorced or Separated
Divorced or Separated Comparison
Menominee
German Russians
11.8%
DIVORCED OR SEPARATED
93.8/ 100
METRIC RATING
122nd/ 347
METRIC RANK
12.0%
DIVORCED OR SEPARATED
61.8/ 100
METRIC RATING
165th/ 347
METRIC RANK
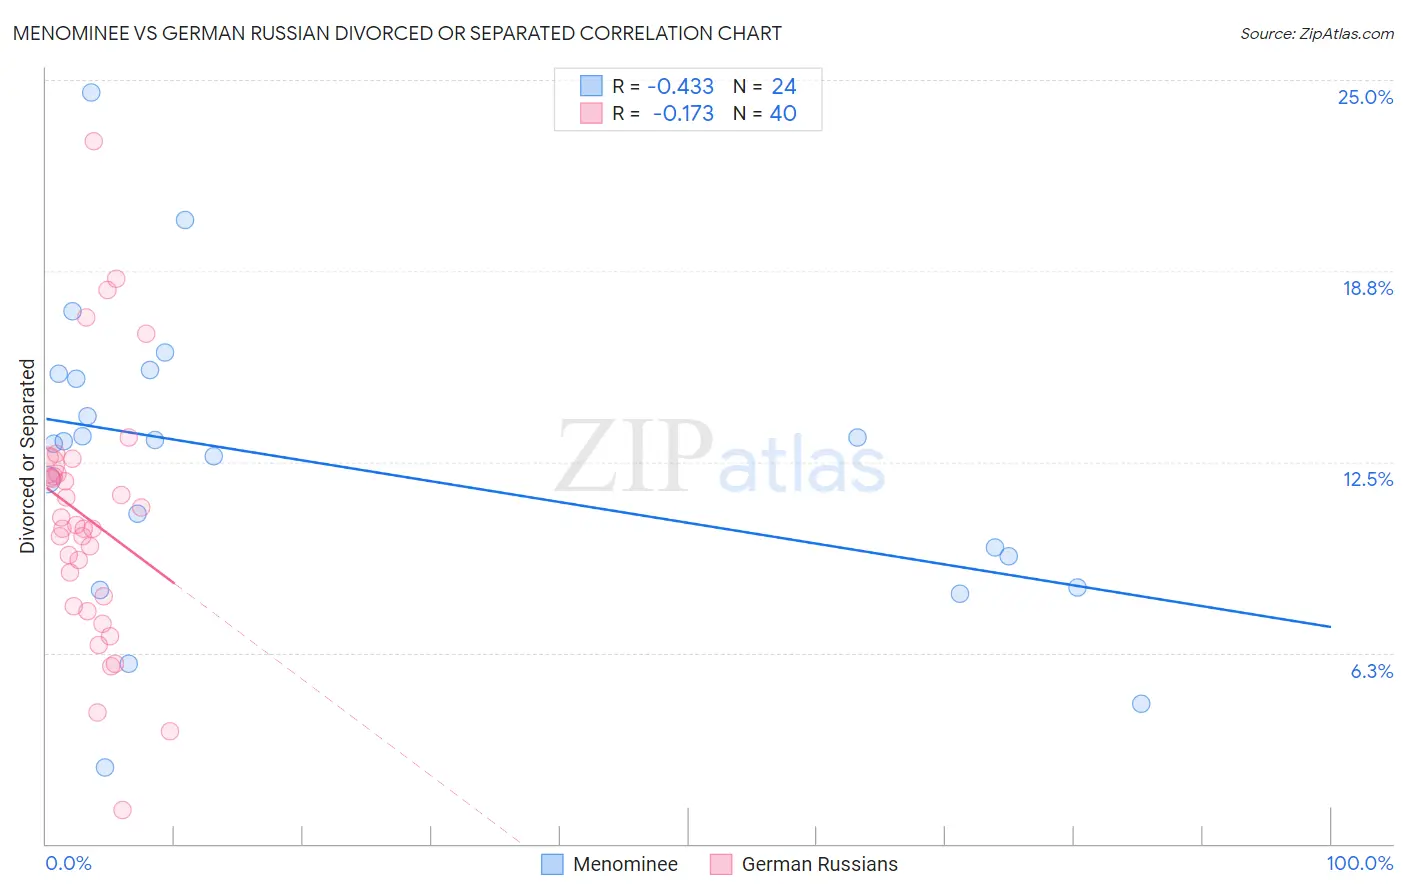
Menominee vs German Russian Divorced or Separated Correlation Chart
The statistical analysis conducted on geographies consisting of 45,778,710 people shows a moderate negative correlation between the proportion of Menominee and percentage of population currently divorced or separated in the United States with a correlation coefficient (R) of -0.433 and weighted average of 11.8%. Similarly, the statistical analysis conducted on geographies consisting of 96,447,174 people shows a poor negative correlation between the proportion of German Russians and percentage of population currently divorced or separated in the United States with a correlation coefficient (R) of -0.173 and weighted average of 12.0%, a difference of 2.0%.
Divorced or Separated Correlation Summary
| Measurement | Menominee | German Russian |
| Minimum | 2.5% | 1.1% |
| Maximum | 24.6% | 23.0% |
| Range | 22.1% | 21.9% |
| Mean | 12.4% | 10.6% |
| Median | 13.1% | 10.4% |
| Interquartile 25% (IQ1) | 8.9% | 7.9% |
| Interquartile 75% (IQ3) | 15.3% | 12.3% |
| Interquartile Range (IQR) | 6.4% | 4.3% |
| Standard Deviation (Sample) | 4.9% | 4.2% |
| Standard Deviation (Population) | 4.8% | 4.1% |
Similar Demographics by Divorced or Separated
Demographics Similar to Menominee by Divorced or Separated
In terms of divorced or separated, the demographic groups most similar to Menominee are Immigrants (11.8%, a difference of 0.020%), Ugandan (11.8%, a difference of 0.090%), Romanian (11.8%, a difference of 0.12%), Iraqi (11.8%, a difference of 0.13%), and Ukrainian (11.8%, a difference of 0.20%).
| Demographics | Rating | Rank | Divorced or Separated |
| Lithuanians | 95.7 /100 | #115 | Exceptional 11.7% |
| Immigrants | Iraq | 95.4 /100 | #116 | Exceptional 11.7% |
| Immigrants | Uganda | 95.3 /100 | #117 | Exceptional 11.7% |
| Ecuadorians | 95.3 /100 | #118 | Exceptional 11.7% |
| Syrians | 95.1 /100 | #119 | Exceptional 11.7% |
| Iraqis | 94.6 /100 | #120 | Exceptional 11.8% |
| Romanians | 94.5 /100 | #121 | Exceptional 11.8% |
| Menominee | 93.8 /100 | #122 | Exceptional 11.8% |
| Immigrants | Immigrants | 93.7 /100 | #123 | Exceptional 11.8% |
| Ugandans | 93.1 /100 | #124 | Exceptional 11.8% |
| Ukrainians | 92.3 /100 | #125 | Exceptional 11.8% |
| South American Indians | 92.1 /100 | #126 | Exceptional 11.8% |
| South Africans | 88.9 /100 | #127 | Excellent 11.8% |
| Immigrants | Ecuador | 88.9 /100 | #128 | Excellent 11.8% |
| Immigrants | St. Vincent and the Grenadines | 88.4 /100 | #129 | Excellent 11.8% |
Demographics Similar to German Russians by Divorced or Separated
In terms of divorced or separated, the demographic groups most similar to German Russians are Tohono O'odham (12.0%, a difference of 0.050%), Swiss (12.0%, a difference of 0.070%), Navajo (12.0%, a difference of 0.080%), Samoan (12.0%, a difference of 0.090%), and Marshallese (12.0%, a difference of 0.11%).
| Demographics | Rating | Rank | Divorced or Separated |
| Icelanders | 66.0 /100 | #158 | Good 12.0% |
| Immigrants | Barbados | 66.0 /100 | #159 | Good 12.0% |
| Immigrants | Scotland | 65.8 /100 | #160 | Good 12.0% |
| Marshallese | 64.6 /100 | #161 | Good 12.0% |
| Samoans | 64.3 /100 | #162 | Good 12.0% |
| Navajo | 63.9 /100 | #163 | Good 12.0% |
| Swiss | 63.6 /100 | #164 | Good 12.0% |
| German Russians | 61.8 /100 | #165 | Good 12.0% |
| Tohono O'odham | 60.4 /100 | #166 | Good 12.0% |
| Ethiopians | 58.5 /100 | #167 | Average 12.0% |
| Serbians | 57.1 /100 | #168 | Average 12.0% |
| Immigrants | Peru | 57.0 /100 | #169 | Average 12.0% |
| Mexican American Indians | 55.8 /100 | #170 | Average 12.0% |
| Costa Ricans | 53.3 /100 | #171 | Average 12.0% |
| Immigrants | Mexico | 53.2 /100 | #172 | Average 12.0% |