Menominee vs Immigrants from Syria Divorced or Separated
COMPARE
Menominee
Immigrants from Syria
Divorced or Separated
Divorced or Separated Comparison
Menominee
Immigrants from Syria
11.8%
DIVORCED OR SEPARATED
93.8/ 100
METRIC RATING
122nd/ 347
METRIC RANK
11.4%
DIVORCED OR SEPARATED
99.7/ 100
METRIC RATING
67th/ 347
METRIC RANK
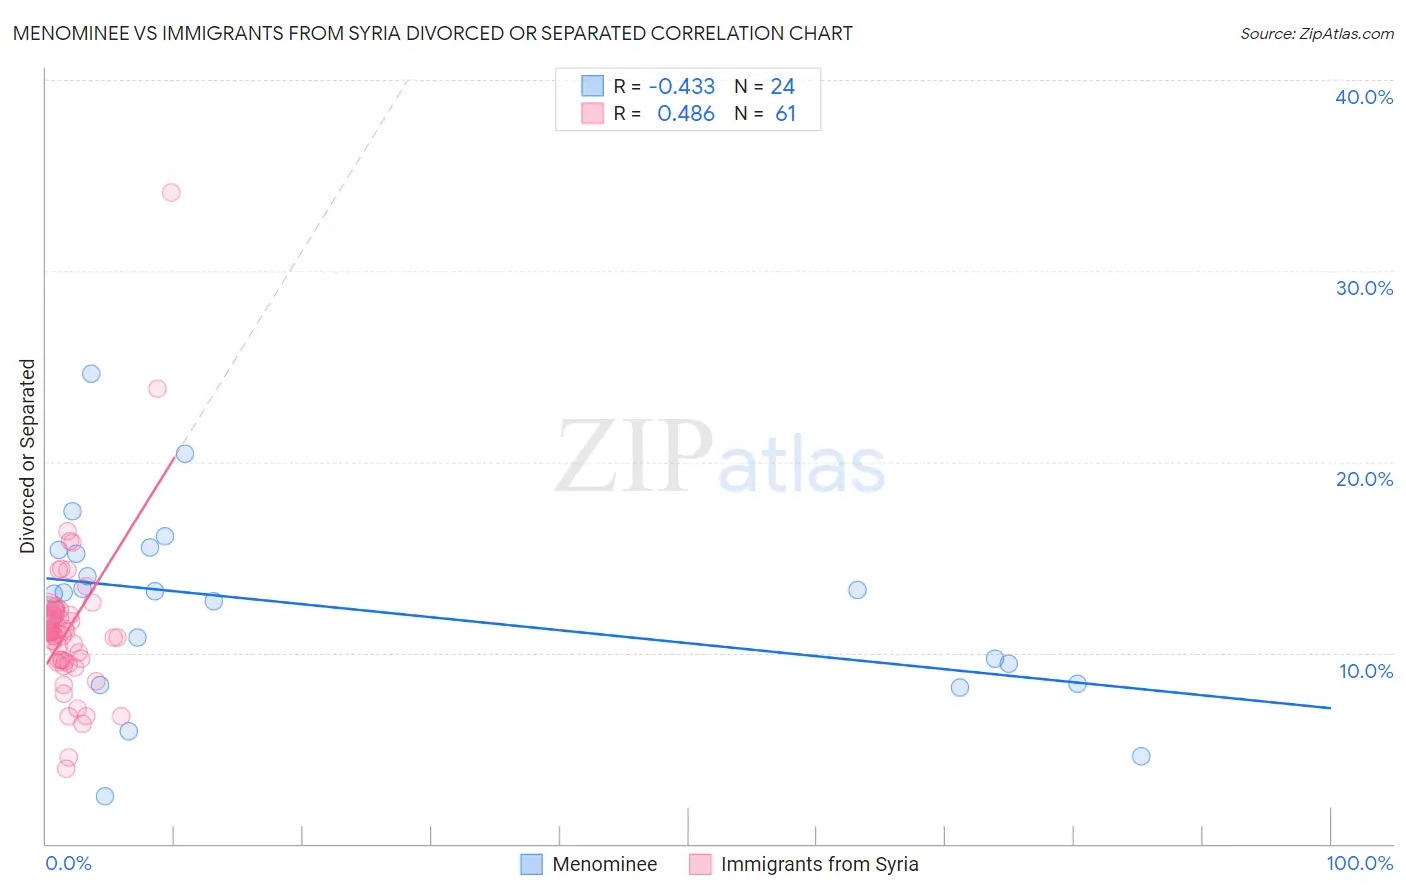
Menominee vs Immigrants from Syria Divorced or Separated Correlation Chart
The statistical analysis conducted on geographies consisting of 45,778,710 people shows a moderate negative correlation between the proportion of Menominee and percentage of population currently divorced or separated in the United States with a correlation coefficient (R) of -0.433 and weighted average of 11.8%. Similarly, the statistical analysis conducted on geographies consisting of 174,113,022 people shows a moderate positive correlation between the proportion of Immigrants from Syria and percentage of population currently divorced or separated in the United States with a correlation coefficient (R) of 0.486 and weighted average of 11.4%, a difference of 2.9%.
Divorced or Separated Correlation Summary
| Measurement | Menominee | Immigrants from Syria |
| Minimum | 2.5% | 3.9% |
| Maximum | 24.6% | 34.1% |
| Range | 22.1% | 30.2% |
| Mean | 12.4% | 11.3% |
| Median | 13.1% | 11.1% |
| Interquartile 25% (IQ1) | 8.9% | 9.6% |
| Interquartile 75% (IQ3) | 15.3% | 12.2% |
| Interquartile Range (IQR) | 6.4% | 2.6% |
| Standard Deviation (Sample) | 4.9% | 4.2% |
| Standard Deviation (Population) | 4.8% | 4.2% |
Similar Demographics by Divorced or Separated
Demographics Similar to Menominee by Divorced or Separated
In terms of divorced or separated, the demographic groups most similar to Menominee are Immigrants (11.8%, a difference of 0.020%), Ugandan (11.8%, a difference of 0.090%), Romanian (11.8%, a difference of 0.12%), Iraqi (11.8%, a difference of 0.13%), and Ukrainian (11.8%, a difference of 0.20%).
| Demographics | Rating | Rank | Divorced or Separated |
| Lithuanians | 95.7 /100 | #115 | Exceptional 11.7% |
| Immigrants | Iraq | 95.4 /100 | #116 | Exceptional 11.7% |
| Immigrants | Uganda | 95.3 /100 | #117 | Exceptional 11.7% |
| Ecuadorians | 95.3 /100 | #118 | Exceptional 11.7% |
| Syrians | 95.1 /100 | #119 | Exceptional 11.7% |
| Iraqis | 94.6 /100 | #120 | Exceptional 11.8% |
| Romanians | 94.5 /100 | #121 | Exceptional 11.8% |
| Menominee | 93.8 /100 | #122 | Exceptional 11.8% |
| Immigrants | Immigrants | 93.7 /100 | #123 | Exceptional 11.8% |
| Ugandans | 93.1 /100 | #124 | Exceptional 11.8% |
| Ukrainians | 92.3 /100 | #125 | Exceptional 11.8% |
| South American Indians | 92.1 /100 | #126 | Exceptional 11.8% |
| South Africans | 88.9 /100 | #127 | Excellent 11.8% |
| Immigrants | Ecuador | 88.9 /100 | #128 | Excellent 11.8% |
| Immigrants | St. Vincent and the Grenadines | 88.4 /100 | #129 | Excellent 11.8% |
Demographics Similar to Immigrants from Syria by Divorced or Separated
In terms of divorced or separated, the demographic groups most similar to Immigrants from Syria are Inupiat (11.4%, a difference of 0.090%), Palestinian (11.5%, a difference of 0.11%), Immigrants from Belgium (11.5%, a difference of 0.11%), Immigrants from Eastern Europe (11.5%, a difference of 0.13%), and Immigrants from South Eastern Asia (11.4%, a difference of 0.23%).
| Demographics | Rating | Rank | Divorced or Separated |
| Immigrants | Russia | 99.9 /100 | #60 | Exceptional 11.3% |
| Koreans | 99.9 /100 | #61 | Exceptional 11.3% |
| Luxembourgers | 99.9 /100 | #62 | Exceptional 11.3% |
| Immigrants | Kuwait | 99.9 /100 | #63 | Exceptional 11.3% |
| Macedonians | 99.8 /100 | #64 | Exceptional 11.4% |
| Immigrants | South Eastern Asia | 99.8 /100 | #65 | Exceptional 11.4% |
| Inupiat | 99.8 /100 | #66 | Exceptional 11.4% |
| Immigrants | Syria | 99.7 /100 | #67 | Exceptional 11.4% |
| Palestinians | 99.7 /100 | #68 | Exceptional 11.5% |
| Immigrants | Belgium | 99.7 /100 | #69 | Exceptional 11.5% |
| Immigrants | Eastern Europe | 99.7 /100 | #70 | Exceptional 11.5% |
| Paraguayans | 99.7 /100 | #71 | Exceptional 11.5% |
| Jordanians | 99.6 /100 | #72 | Exceptional 11.5% |
| Immigrants | North Macedonia | 99.6 /100 | #73 | Exceptional 11.5% |
| Taiwanese | 99.6 /100 | #74 | Exceptional 11.5% |