Venezuelan vs Mongolian Divorced or Separated
COMPARE
Venezuelan
Mongolian
Divorced or Separated
Divorced or Separated Comparison
Venezuelans
Mongolians
13.0%
DIVORCED OR SEPARATED
0.0/ 100
METRIC RATING
298th/ 347
METRIC RANK
11.1%
DIVORCED OR SEPARATED
100.0/ 100
METRIC RATING
31st/ 347
METRIC RANK
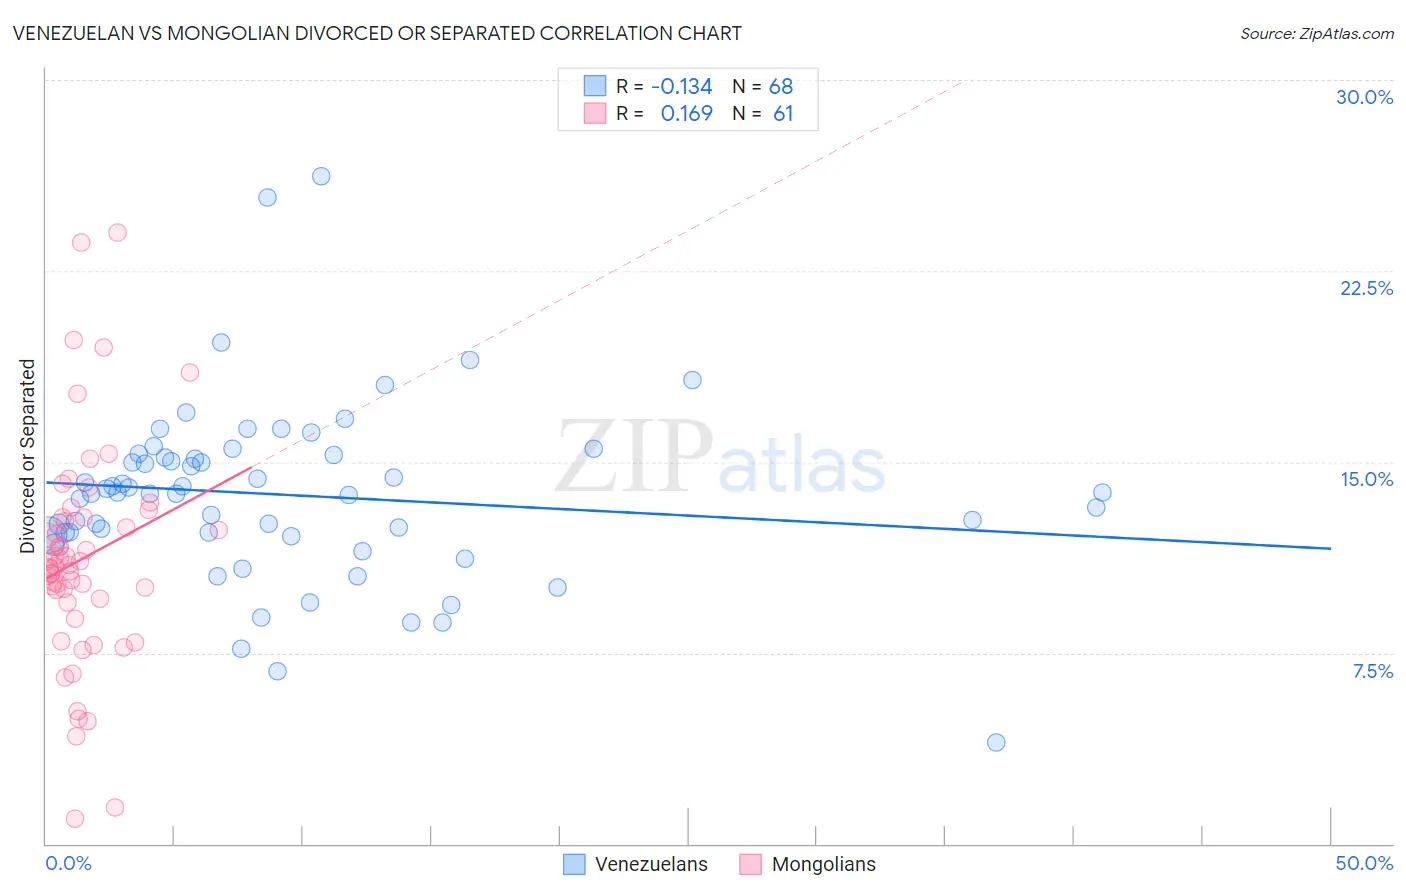
Venezuelan vs Mongolian Divorced or Separated Correlation Chart
The statistical analysis conducted on geographies consisting of 306,203,759 people shows a poor negative correlation between the proportion of Venezuelans and percentage of population currently divorced or separated in the United States with a correlation coefficient (R) of -0.134 and weighted average of 13.0%. Similarly, the statistical analysis conducted on geographies consisting of 140,326,151 people shows a poor positive correlation between the proportion of Mongolians and percentage of population currently divorced or separated in the United States with a correlation coefficient (R) of 0.169 and weighted average of 11.1%, a difference of 17.7%.
Divorced or Separated Correlation Summary
| Measurement | Venezuelan | Mongolian |
| Minimum | 4.0% | 1.0% |
| Maximum | 26.2% | 24.0% |
| Range | 22.2% | 23.0% |
| Mean | 13.7% | 11.2% |
| Median | 13.8% | 10.9% |
| Interquartile 25% (IQ1) | 12.2% | 9.5% |
| Interquartile 75% (IQ3) | 15.2% | 12.8% |
| Interquartile Range (IQR) | 3.0% | 3.3% |
| Standard Deviation (Sample) | 3.5% | 4.3% |
| Standard Deviation (Population) | 3.5% | 4.3% |
Similar Demographics by Divorced or Separated
Demographics Similar to Venezuelans by Divorced or Separated
In terms of divorced or separated, the demographic groups most similar to Venezuelans are Immigrants from Jamaica (13.0%, a difference of 0.040%), Native/Alaskan (13.0%, a difference of 0.070%), Nicaraguan (13.0%, a difference of 0.12%), Celtic (13.0%, a difference of 0.54%), and Immigrants from Cabo Verde (13.1%, a difference of 0.59%).
| Demographics | Rating | Rank | Divorced or Separated |
| Immigrants | Honduras | 0.0 /100 | #291 | Tragic 12.9% |
| Scotch-Irish | 0.0 /100 | #292 | Tragic 12.9% |
| Jamaicans | 0.0 /100 | #293 | Tragic 12.9% |
| Apache | 0.0 /100 | #294 | Tragic 12.9% |
| Celtics | 0.0 /100 | #295 | Tragic 13.0% |
| Nicaraguans | 0.0 /100 | #296 | Tragic 13.0% |
| Natives/Alaskans | 0.0 /100 | #297 | Tragic 13.0% |
| Venezuelans | 0.0 /100 | #298 | Tragic 13.0% |
| Immigrants | Jamaica | 0.0 /100 | #299 | Tragic 13.0% |
| Immigrants | Cabo Verde | 0.0 /100 | #300 | Tragic 13.1% |
| Alaskan Athabascans | 0.0 /100 | #301 | Tragic 13.1% |
| Immigrants | Venezuela | 0.0 /100 | #302 | Tragic 13.1% |
| Cape Verdeans | 0.0 /100 | #303 | Tragic 13.1% |
| Hopi | 0.0 /100 | #304 | Tragic 13.2% |
| Chippewa | 0.0 /100 | #305 | Tragic 13.2% |
Demographics Similar to Mongolians by Divorced or Separated
In terms of divorced or separated, the demographic groups most similar to Mongolians are Tongan (11.1%, a difference of 0.080%), Egyptian (11.1%, a difference of 0.12%), Immigrants from Uzbekistan (11.1%, a difference of 0.19%), Cambodian (11.1%, a difference of 0.27%), and Immigrants from Ireland (11.0%, a difference of 0.30%).
| Demographics | Rating | Rank | Divorced or Separated |
| Immigrants | Sri Lanka | 100.0 /100 | #24 | Exceptional 10.8% |
| Iranians | 100.0 /100 | #25 | Exceptional 10.8% |
| Immigrants | Indonesia | 100.0 /100 | #26 | Exceptional 10.9% |
| Immigrants | Bangladesh | 100.0 /100 | #27 | Exceptional 11.0% |
| Immigrants | Malaysia | 100.0 /100 | #28 | Exceptional 11.0% |
| Armenians | 100.0 /100 | #29 | Exceptional 11.0% |
| Immigrants | Ireland | 100.0 /100 | #30 | Exceptional 11.0% |
| Mongolians | 100.0 /100 | #31 | Exceptional 11.1% |
| Tongans | 100.0 /100 | #32 | Exceptional 11.1% |
| Egyptians | 100.0 /100 | #33 | Exceptional 11.1% |
| Immigrants | Uzbekistan | 100.0 /100 | #34 | Exceptional 11.1% |
| Cambodians | 100.0 /100 | #35 | Exceptional 11.1% |
| Immigrants | Japan | 100.0 /100 | #36 | Exceptional 11.1% |
| Immigrants | Lebanon | 100.0 /100 | #37 | Exceptional 11.1% |
| Immigrants | Greece | 100.0 /100 | #38 | Exceptional 11.1% |