Immigrants from Bangladesh vs Mongolian Divorced or Separated
COMPARE
Immigrants from Bangladesh
Mongolian
Divorced or Separated
Divorced or Separated Comparison
Immigrants from Bangladesh
Mongolians
11.0%
DIVORCED OR SEPARATED
100.0/ 100
METRIC RATING
27th/ 347
METRIC RANK
11.1%
DIVORCED OR SEPARATED
100.0/ 100
METRIC RATING
31st/ 347
METRIC RANK
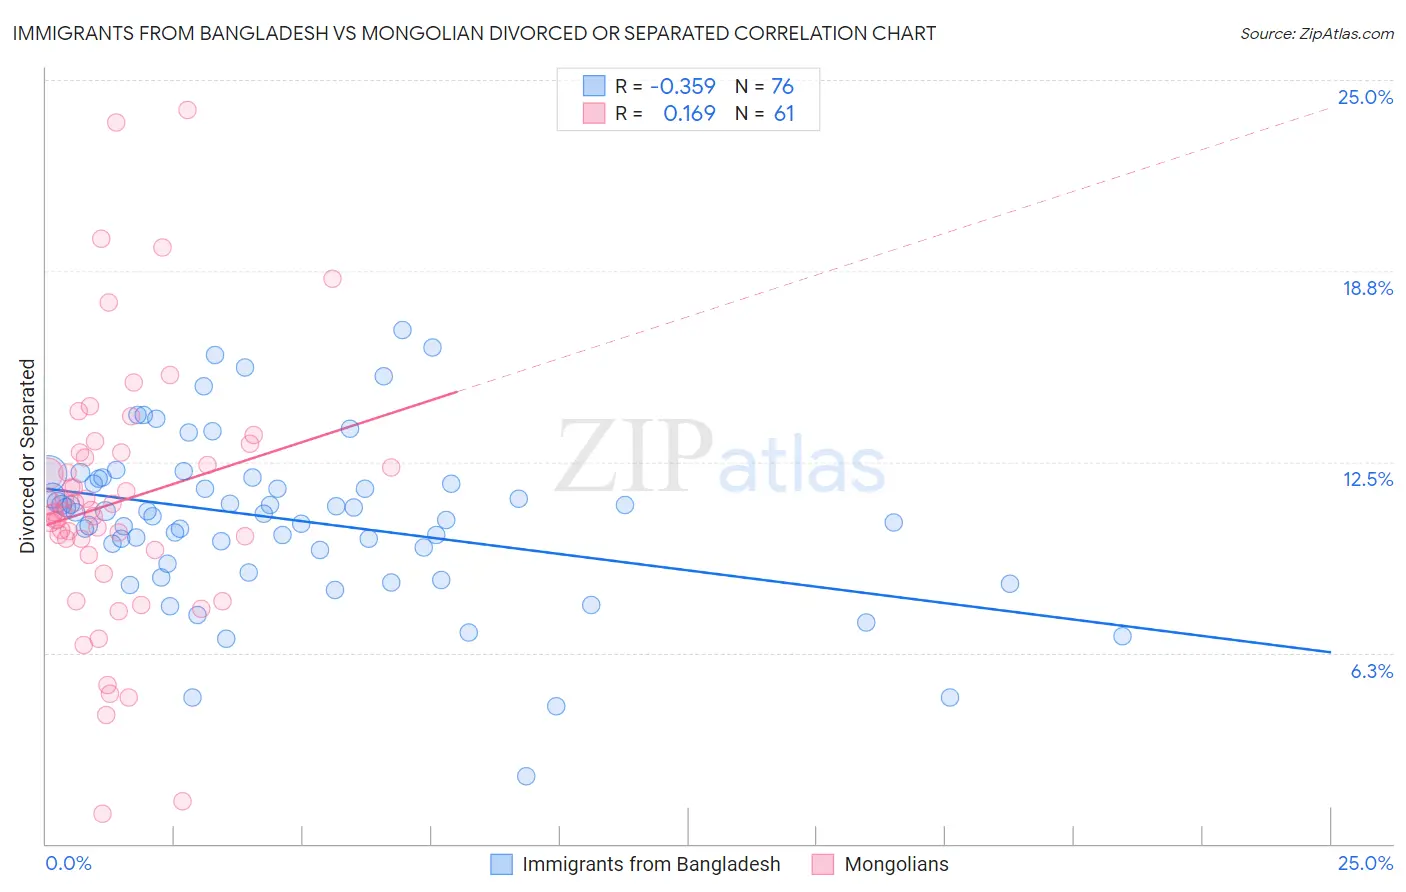
Immigrants from Bangladesh vs Mongolian Divorced or Separated Correlation Chart
The statistical analysis conducted on geographies consisting of 203,592,218 people shows a mild negative correlation between the proportion of Immigrants from Bangladesh and percentage of population currently divorced or separated in the United States with a correlation coefficient (R) of -0.359 and weighted average of 11.0%. Similarly, the statistical analysis conducted on geographies consisting of 140,326,151 people shows a poor positive correlation between the proportion of Mongolians and percentage of population currently divorced or separated in the United States with a correlation coefficient (R) of 0.169 and weighted average of 11.1%, a difference of 0.92%.
Divorced or Separated Correlation Summary
| Measurement | Immigrants from Bangladesh | Mongolian |
| Minimum | 2.2% | 1.0% |
| Maximum | 16.8% | 24.0% |
| Range | 14.6% | 23.0% |
| Mean | 10.6% | 11.2% |
| Median | 10.8% | 10.9% |
| Interquartile 25% (IQ1) | 9.4% | 9.5% |
| Interquartile 75% (IQ3) | 11.9% | 12.8% |
| Interquartile Range (IQR) | 2.5% | 3.3% |
| Standard Deviation (Sample) | 2.7% | 4.3% |
| Standard Deviation (Population) | 2.7% | 4.3% |
Demographics Similar to Immigrants from Bangladesh and Mongolians by Divorced or Separated
In terms of divorced or separated, the demographic groups most similar to Immigrants from Bangladesh are Immigrants from Malaysia (11.0%, a difference of 0.030%), Armenian (11.0%, a difference of 0.10%), Immigrants from Indonesia (10.9%, a difference of 0.44%), Immigrants from Ireland (11.0%, a difference of 0.62%), and Tongan (11.1%, a difference of 1.0%). Similarly, the demographic groups most similar to Mongolians are Tongan (11.1%, a difference of 0.080%), Egyptian (11.1%, a difference of 0.12%), Immigrants from Uzbekistan (11.1%, a difference of 0.19%), Cambodian (11.1%, a difference of 0.27%), and Immigrants from Ireland (11.0%, a difference of 0.30%).
| Demographics | Rating | Rank | Divorced or Separated |
| Asians | 100.0 /100 | #19 | Exceptional 10.6% |
| Burmese | 100.0 /100 | #20 | Exceptional 10.7% |
| Immigrants | Asia | 100.0 /100 | #21 | Exceptional 10.7% |
| Vietnamese | 100.0 /100 | #22 | Exceptional 10.8% |
| Immigrants | Pakistan | 100.0 /100 | #23 | Exceptional 10.8% |
| Immigrants | Sri Lanka | 100.0 /100 | #24 | Exceptional 10.8% |
| Iranians | 100.0 /100 | #25 | Exceptional 10.8% |
| Immigrants | Indonesia | 100.0 /100 | #26 | Exceptional 10.9% |
| Immigrants | Bangladesh | 100.0 /100 | #27 | Exceptional 11.0% |
| Immigrants | Malaysia | 100.0 /100 | #28 | Exceptional 11.0% |
| Armenians | 100.0 /100 | #29 | Exceptional 11.0% |
| Immigrants | Ireland | 100.0 /100 | #30 | Exceptional 11.0% |
| Mongolians | 100.0 /100 | #31 | Exceptional 11.1% |
| Tongans | 100.0 /100 | #32 | Exceptional 11.1% |
| Egyptians | 100.0 /100 | #33 | Exceptional 11.1% |
| Immigrants | Uzbekistan | 100.0 /100 | #34 | Exceptional 11.1% |
| Cambodians | 100.0 /100 | #35 | Exceptional 11.1% |
| Immigrants | Japan | 100.0 /100 | #36 | Exceptional 11.1% |
| Immigrants | Lebanon | 100.0 /100 | #37 | Exceptional 11.1% |
| Immigrants | Greece | 100.0 /100 | #38 | Exceptional 11.1% |
| Immigrants | Egypt | 100.0 /100 | #39 | Exceptional 11.1% |