Immigrants from Bolivia vs Immigrants from Syria Divorced or Separated
COMPARE
Immigrants from Bolivia
Immigrants from Syria
Divorced or Separated
Divorced or Separated Comparison
Immigrants from Bolivia
Immigrants from Syria
11.3%
DIVORCED OR SEPARATED
100.0/ 100
METRIC RATING
51st/ 347
METRIC RANK
11.4%
DIVORCED OR SEPARATED
99.7/ 100
METRIC RATING
67th/ 347
METRIC RANK
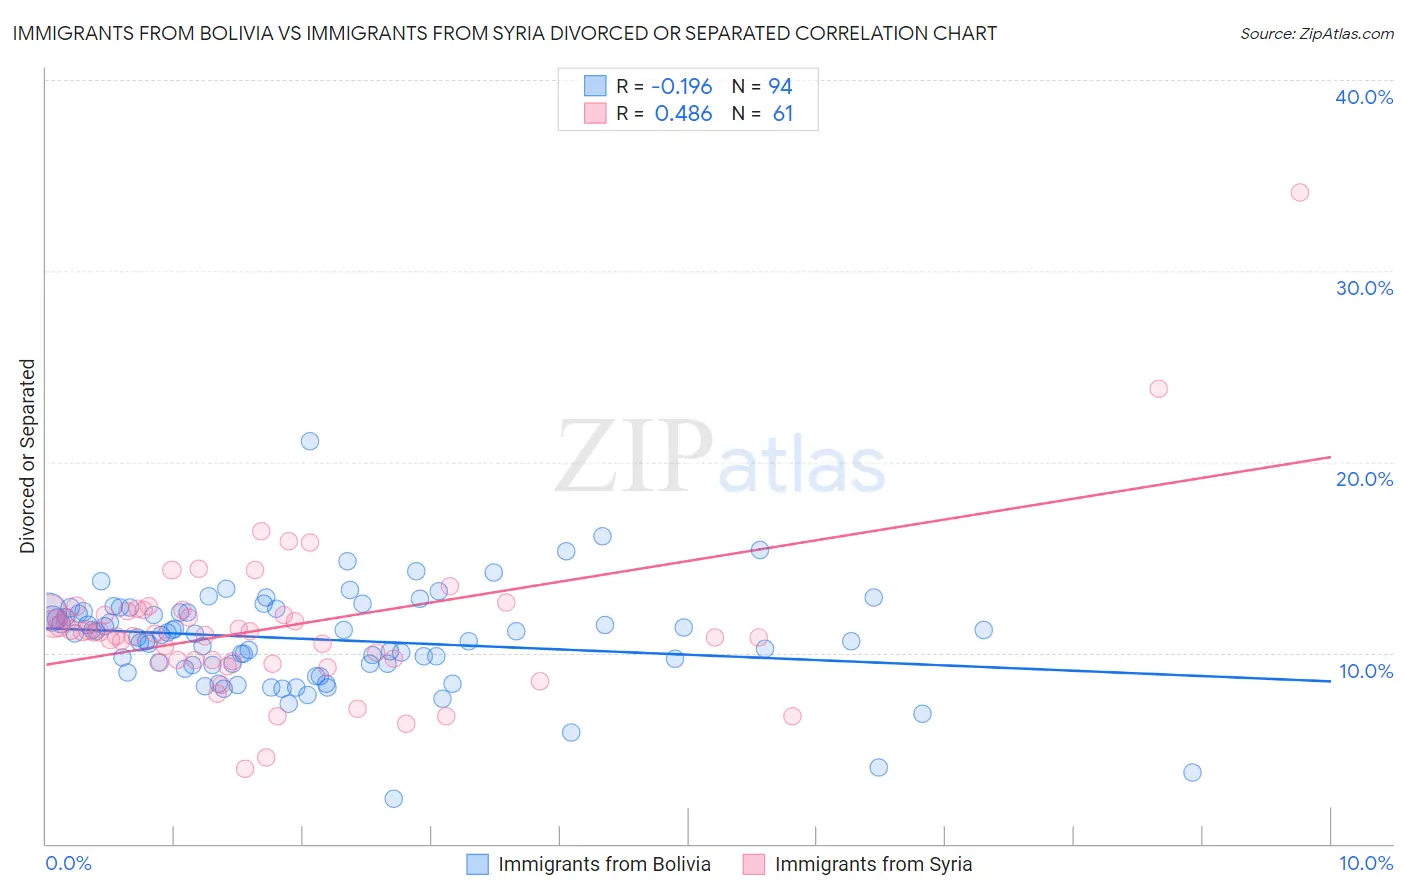
Immigrants from Bolivia vs Immigrants from Syria Divorced or Separated Correlation Chart
The statistical analysis conducted on geographies consisting of 158,719,701 people shows a poor negative correlation between the proportion of Immigrants from Bolivia and percentage of population currently divorced or separated in the United States with a correlation coefficient (R) of -0.196 and weighted average of 11.3%. Similarly, the statistical analysis conducted on geographies consisting of 174,113,022 people shows a moderate positive correlation between the proportion of Immigrants from Syria and percentage of population currently divorced or separated in the United States with a correlation coefficient (R) of 0.486 and weighted average of 11.4%, a difference of 1.7%.
Divorced or Separated Correlation Summary
| Measurement | Immigrants from Bolivia | Immigrants from Syria |
| Minimum | 2.4% | 3.9% |
| Maximum | 21.1% | 34.1% |
| Range | 18.7% | 30.2% |
| Mean | 10.7% | 11.3% |
| Median | 11.0% | 11.1% |
| Interquartile 25% (IQ1) | 9.4% | 9.6% |
| Interquartile 75% (IQ3) | 12.1% | 12.2% |
| Interquartile Range (IQR) | 2.8% | 2.6% |
| Standard Deviation (Sample) | 2.6% | 4.2% |
| Standard Deviation (Population) | 2.6% | 4.2% |
Demographics Similar to Immigrants from Bolivia and Immigrants from Syria by Divorced or Separated
In terms of divorced or separated, the demographic groups most similar to Immigrants from Bolivia are Immigrants from Australia (11.3%, a difference of 0.11%), Bolivian (11.2%, a difference of 0.30%), Immigrants from Lithuania (11.3%, a difference of 0.33%), Immigrants from Saudi Arabia (11.2%, a difference of 0.36%), and Eastern European (11.3%, a difference of 0.45%). Similarly, the demographic groups most similar to Immigrants from Syria are Inupiat (11.4%, a difference of 0.090%), Palestinian (11.5%, a difference of 0.11%), Immigrants from Belgium (11.5%, a difference of 0.11%), Immigrants from South Eastern Asia (11.4%, a difference of 0.23%), and Macedonian (11.4%, a difference of 0.27%).
| Demographics | Rating | Rank | Divorced or Separated |
| Immigrants | Saudi Arabia | 100.0 /100 | #49 | Exceptional 11.2% |
| Bolivians | 100.0 /100 | #50 | Exceptional 11.2% |
| Immigrants | Bolivia | 100.0 /100 | #51 | Exceptional 11.3% |
| Immigrants | Australia | 99.9 /100 | #52 | Exceptional 11.3% |
| Immigrants | Lithuania | 99.9 /100 | #53 | Exceptional 11.3% |
| Eastern Europeans | 99.9 /100 | #54 | Exceptional 11.3% |
| Immigrants | Yemen | 99.9 /100 | #55 | Exceptional 11.3% |
| Immigrants | Philippines | 99.9 /100 | #56 | Exceptional 11.3% |
| Immigrants | Vietnam | 99.9 /100 | #57 | Exceptional 11.3% |
| Sri Lankans | 99.9 /100 | #58 | Exceptional 11.3% |
| Israelis | 99.9 /100 | #59 | Exceptional 11.3% |
| Immigrants | Russia | 99.9 /100 | #60 | Exceptional 11.3% |
| Koreans | 99.9 /100 | #61 | Exceptional 11.3% |
| Luxembourgers | 99.9 /100 | #62 | Exceptional 11.3% |
| Immigrants | Kuwait | 99.9 /100 | #63 | Exceptional 11.3% |
| Macedonians | 99.8 /100 | #64 | Exceptional 11.4% |
| Immigrants | South Eastern Asia | 99.8 /100 | #65 | Exceptional 11.4% |
| Inupiat | 99.8 /100 | #66 | Exceptional 11.4% |
| Immigrants | Syria | 99.7 /100 | #67 | Exceptional 11.4% |
| Palestinians | 99.7 /100 | #68 | Exceptional 11.5% |
| Immigrants | Belgium | 99.7 /100 | #69 | Exceptional 11.5% |