Peruvian vs German Russian Divorced or Separated
COMPARE
Peruvian
German Russian
Divorced or Separated
Divorced or Separated Comparison
Peruvians
German Russians
11.9%
DIVORCED OR SEPARATED
80.9/ 100
METRIC RATING
144th/ 347
METRIC RANK
12.0%
DIVORCED OR SEPARATED
61.8/ 100
METRIC RATING
165th/ 347
METRIC RANK
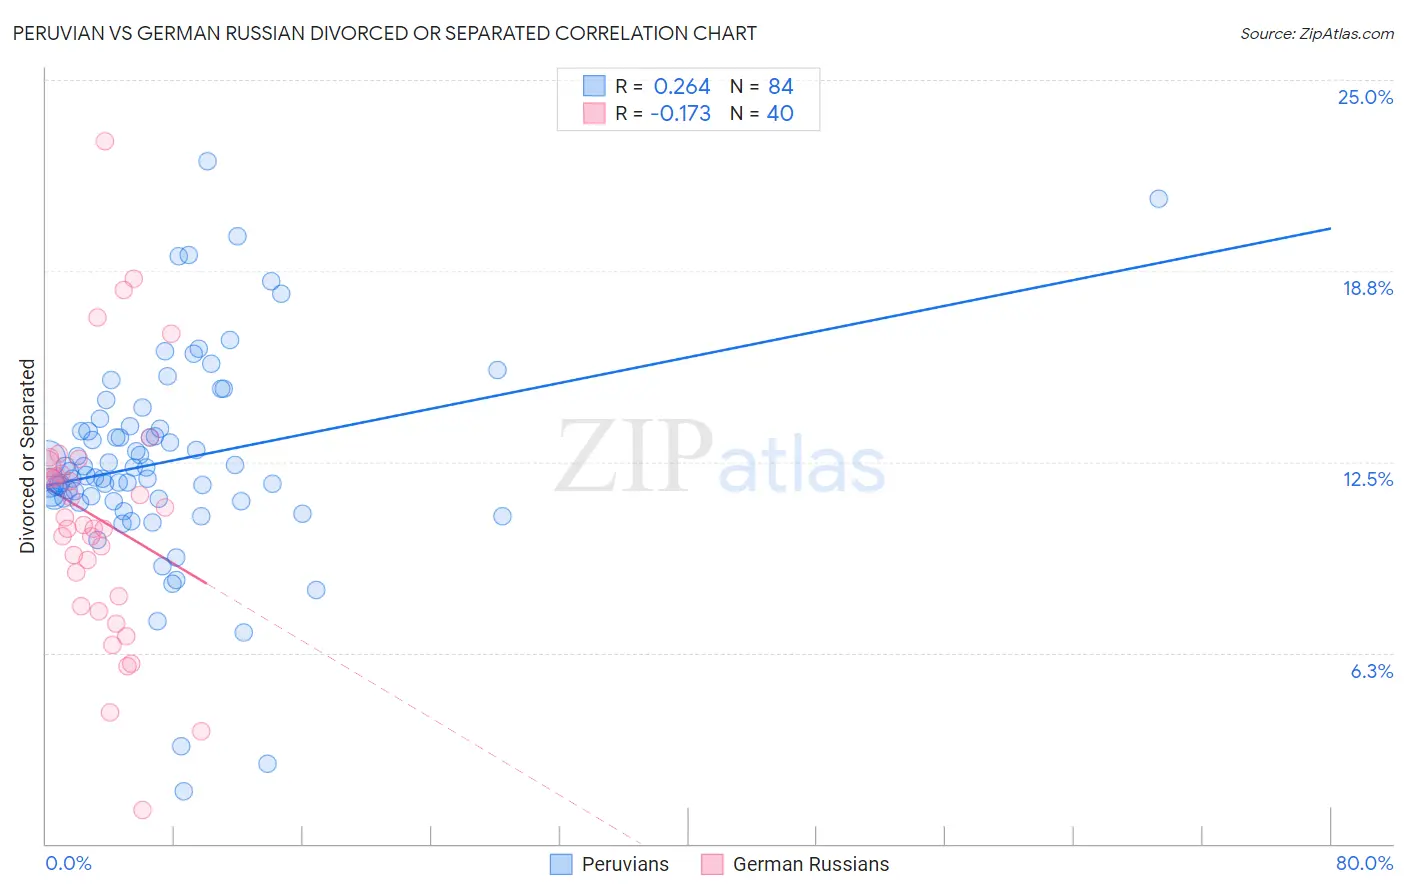
Peruvian vs German Russian Divorced or Separated Correlation Chart
The statistical analysis conducted on geographies consisting of 363,080,575 people shows a weak positive correlation between the proportion of Peruvians and percentage of population currently divorced or separated in the United States with a correlation coefficient (R) of 0.264 and weighted average of 11.9%. Similarly, the statistical analysis conducted on geographies consisting of 96,447,174 people shows a poor negative correlation between the proportion of German Russians and percentage of population currently divorced or separated in the United States with a correlation coefficient (R) of -0.173 and weighted average of 12.0%, a difference of 0.84%.
Divorced or Separated Correlation Summary
| Measurement | Peruvian | German Russian |
| Minimum | 1.7% | 1.1% |
| Maximum | 22.4% | 23.0% |
| Range | 20.7% | 21.9% |
| Mean | 12.5% | 10.6% |
| Median | 12.1% | 10.4% |
| Interquartile 25% (IQ1) | 11.3% | 7.9% |
| Interquartile 75% (IQ3) | 13.6% | 12.3% |
| Interquartile Range (IQR) | 2.4% | 4.3% |
| Standard Deviation (Sample) | 3.4% | 4.2% |
| Standard Deviation (Population) | 3.4% | 4.1% |
Similar Demographics by Divorced or Separated
Demographics Similar to Peruvians by Divorced or Separated
In terms of divorced or separated, the demographic groups most similar to Peruvians are Croatian (11.9%, a difference of 0.020%), Immigrants from Zimbabwe (11.9%, a difference of 0.030%), Pakistani (11.9%, a difference of 0.030%), Immigrants from Grenada (11.9%, a difference of 0.10%), and Immigrants from Morocco (11.9%, a difference of 0.12%).
| Demographics | Rating | Rank | Divorced or Separated |
| Alsatians | 84.0 /100 | #137 | Excellent 11.9% |
| Immigrants | Netherlands | 83.9 /100 | #138 | Excellent 11.9% |
| Australians | 83.6 /100 | #139 | Excellent 11.9% |
| Lebanese | 83.4 /100 | #140 | Excellent 11.9% |
| Immigrants | Morocco | 82.9 /100 | #141 | Excellent 11.9% |
| Immigrants | Zimbabwe | 81.5 /100 | #142 | Excellent 11.9% |
| Pakistanis | 81.3 /100 | #143 | Excellent 11.9% |
| Peruvians | 80.9 /100 | #144 | Excellent 11.9% |
| Croatians | 80.6 /100 | #145 | Excellent 11.9% |
| Immigrants | Grenada | 79.1 /100 | #146 | Good 11.9% |
| Poles | 78.6 /100 | #147 | Good 11.9% |
| Italians | 77.8 /100 | #148 | Good 11.9% |
| Immigrants | Oceania | 77.7 /100 | #149 | Good 11.9% |
| Immigrants | Portugal | 77.3 /100 | #150 | Good 11.9% |
| Czechs | 76.4 /100 | #151 | Good 11.9% |
Demographics Similar to German Russians by Divorced or Separated
In terms of divorced or separated, the demographic groups most similar to German Russians are Tohono O'odham (12.0%, a difference of 0.050%), Swiss (12.0%, a difference of 0.070%), Navajo (12.0%, a difference of 0.080%), Samoan (12.0%, a difference of 0.090%), and Marshallese (12.0%, a difference of 0.11%).
| Demographics | Rating | Rank | Divorced or Separated |
| Icelanders | 66.0 /100 | #158 | Good 12.0% |
| Immigrants | Barbados | 66.0 /100 | #159 | Good 12.0% |
| Immigrants | Scotland | 65.8 /100 | #160 | Good 12.0% |
| Marshallese | 64.6 /100 | #161 | Good 12.0% |
| Samoans | 64.3 /100 | #162 | Good 12.0% |
| Navajo | 63.9 /100 | #163 | Good 12.0% |
| Swiss | 63.6 /100 | #164 | Good 12.0% |
| German Russians | 61.8 /100 | #165 | Good 12.0% |
| Tohono O'odham | 60.4 /100 | #166 | Good 12.0% |
| Ethiopians | 58.5 /100 | #167 | Average 12.0% |
| Serbians | 57.1 /100 | #168 | Average 12.0% |
| Immigrants | Peru | 57.0 /100 | #169 | Average 12.0% |
| Mexican American Indians | 55.8 /100 | #170 | Average 12.0% |
| Costa Ricans | 53.3 /100 | #171 | Average 12.0% |
| Immigrants | Mexico | 53.2 /100 | #172 | Average 12.0% |