Immigrants from Oceania vs German Russian Divorced or Separated
COMPARE
Immigrants from Oceania
German Russian
Divorced or Separated
Divorced or Separated Comparison
Immigrants from Oceania
German Russians
11.9%
DIVORCED OR SEPARATED
77.7/ 100
METRIC RATING
149th/ 347
METRIC RANK
12.0%
DIVORCED OR SEPARATED
61.8/ 100
METRIC RATING
165th/ 347
METRIC RANK
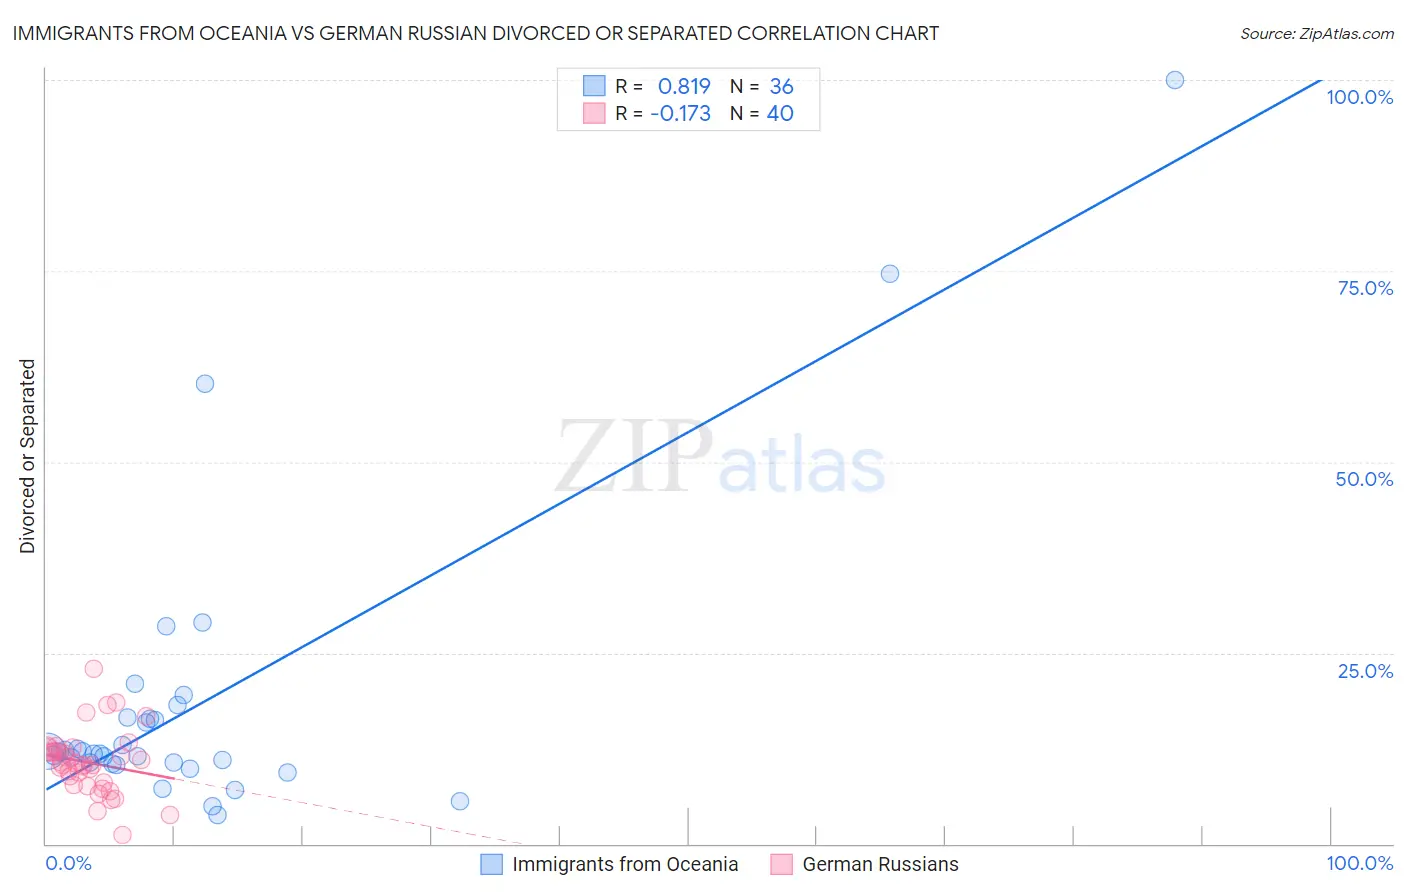
Immigrants from Oceania vs German Russian Divorced or Separated Correlation Chart
The statistical analysis conducted on geographies consisting of 305,431,368 people shows a very strong positive correlation between the proportion of Immigrants from Oceania and percentage of population currently divorced or separated in the United States with a correlation coefficient (R) of 0.819 and weighted average of 11.9%. Similarly, the statistical analysis conducted on geographies consisting of 96,447,174 people shows a poor negative correlation between the proportion of German Russians and percentage of population currently divorced or separated in the United States with a correlation coefficient (R) of -0.173 and weighted average of 12.0%, a difference of 0.67%.
Divorced or Separated Correlation Summary
| Measurement | Immigrants from Oceania | German Russian |
| Minimum | 3.7% | 1.1% |
| Maximum | 100.0% | 23.0% |
| Range | 96.3% | 21.9% |
| Mean | 18.3% | 10.6% |
| Median | 11.9% | 10.4% |
| Interquartile 25% (IQ1) | 10.5% | 7.9% |
| Interquartile 75% (IQ3) | 16.5% | 12.3% |
| Interquartile Range (IQR) | 5.9% | 4.3% |
| Standard Deviation (Sample) | 19.7% | 4.2% |
| Standard Deviation (Population) | 19.4% | 4.1% |
Demographics Similar to Immigrants from Oceania and German Russians by Divorced or Separated
In terms of divorced or separated, the demographic groups most similar to Immigrants from Oceania are Italian (11.9%, a difference of 0.0%), Immigrants from Portugal (11.9%, a difference of 0.020%), Polish (11.9%, a difference of 0.050%), Czech (11.9%, a difference of 0.060%), and Immigrants from Hungary (11.9%, a difference of 0.19%). Similarly, the demographic groups most similar to German Russians are Tohono O'odham (12.0%, a difference of 0.050%), Swiss (12.0%, a difference of 0.070%), Navajo (12.0%, a difference of 0.080%), Samoan (12.0%, a difference of 0.090%), and Marshallese (12.0%, a difference of 0.11%).
| Demographics | Rating | Rank | Divorced or Separated |
| Poles | 78.6 /100 | #147 | Good 11.9% |
| Italians | 77.8 /100 | #148 | Good 11.9% |
| Immigrants | Oceania | 77.7 /100 | #149 | Good 11.9% |
| Immigrants | Portugal | 77.3 /100 | #150 | Good 11.9% |
| Czechs | 76.4 /100 | #151 | Good 11.9% |
| Immigrants | Hungary | 73.7 /100 | #152 | Good 11.9% |
| Austrians | 72.2 /100 | #153 | Good 12.0% |
| Chileans | 71.3 /100 | #154 | Good 12.0% |
| Japanese | 70.9 /100 | #155 | Good 12.0% |
| Hungarians | 70.3 /100 | #156 | Good 12.0% |
| Immigrants | Brazil | 68.8 /100 | #157 | Good 12.0% |
| Icelanders | 66.0 /100 | #158 | Good 12.0% |
| Immigrants | Barbados | 66.0 /100 | #159 | Good 12.0% |
| Immigrants | Scotland | 65.8 /100 | #160 | Good 12.0% |
| Marshallese | 64.6 /100 | #161 | Good 12.0% |
| Samoans | 64.3 /100 | #162 | Good 12.0% |
| Navajo | 63.9 /100 | #163 | Good 12.0% |
| Swiss | 63.6 /100 | #164 | Good 12.0% |
| German Russians | 61.8 /100 | #165 | Good 12.0% |
| Tohono O'odham | 60.4 /100 | #166 | Good 12.0% |
| Ethiopians | 58.5 /100 | #167 | Average 12.0% |