Maltese vs Carpatho Rusyn Births to Unmarried Women
COMPARE
Maltese
Carpatho Rusyn
Births to Unmarried Women
Births to Unmarried Women Comparison
Maltese
Carpatho Rusyns
27.8%
BIRTHS TO UNMARRIED WOMEN
99.4/ 100
METRIC RATING
50th/ 347
METRIC RANK
30.9%
BIRTHS TO UNMARRIED WOMEN
73.5/ 100
METRIC RATING
156th/ 347
METRIC RANK
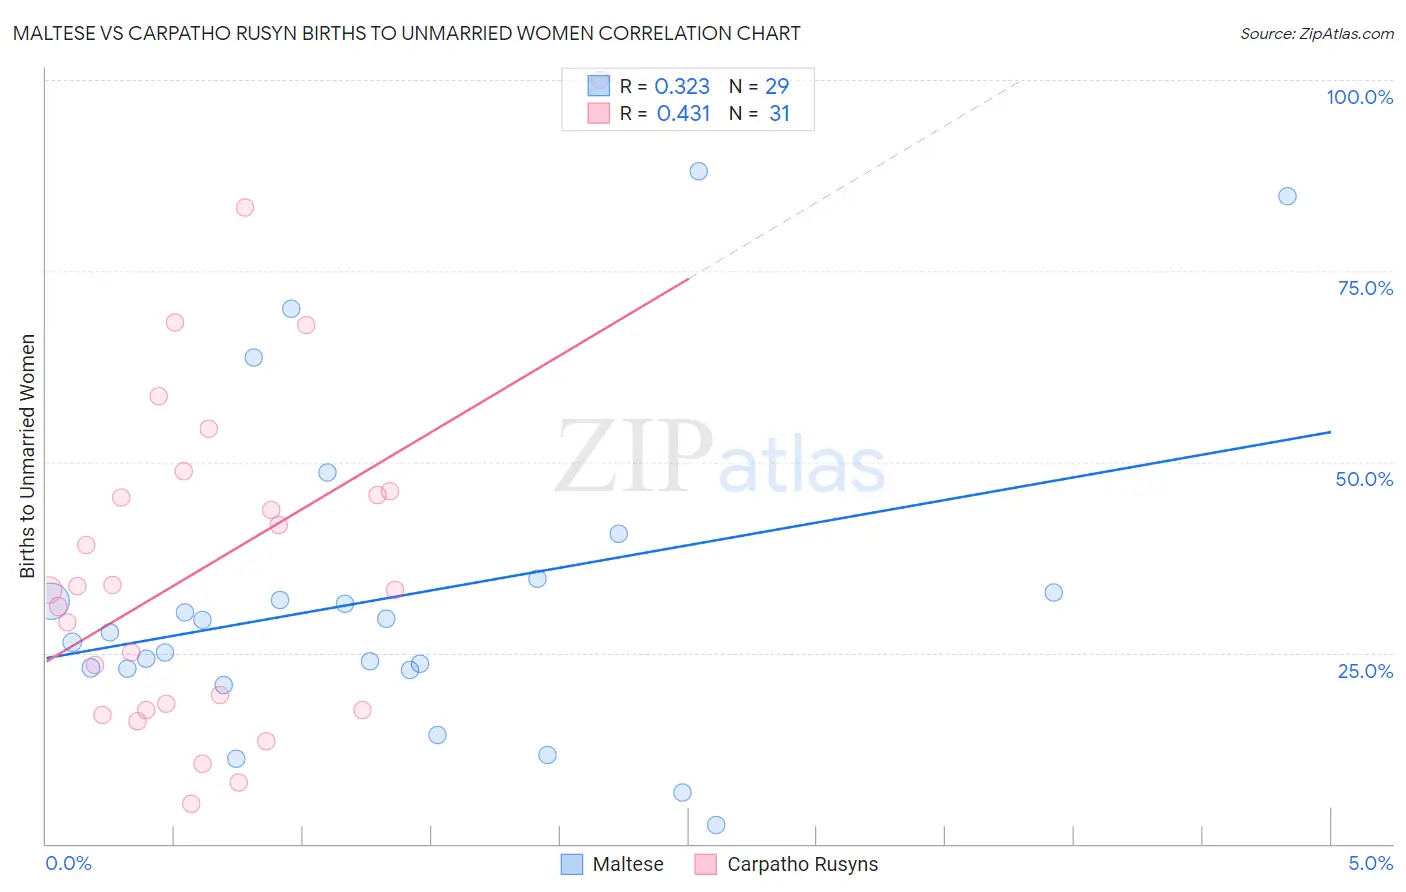
Maltese vs Carpatho Rusyn Births to Unmarried Women Correlation Chart
The statistical analysis conducted on geographies consisting of 121,147,000 people shows a mild positive correlation between the proportion of Maltese and percentage of births to unmarried women in the United States with a correlation coefficient (R) of 0.323 and weighted average of 27.8%. Similarly, the statistical analysis conducted on geographies consisting of 56,982,210 people shows a moderate positive correlation between the proportion of Carpatho Rusyns and percentage of births to unmarried women in the United States with a correlation coefficient (R) of 0.431 and weighted average of 30.9%, a difference of 11.1%.
Births to Unmarried Women Correlation Summary
| Measurement | Maltese | Carpatho Rusyn |
| Minimum | 2.4% | 5.2% |
| Maximum | 88.0% | 100.0% |
| Range | 85.6% | 94.8% |
| Mean | 32.2% | 36.4% |
| Median | 27.6% | 33.3% |
| Interquartile 25% (IQ1) | 22.9% | 17.5% |
| Interquartile 75% (IQ3) | 33.8% | 46.2% |
| Interquartile Range (IQR) | 10.9% | 28.7% |
| Standard Deviation (Sample) | 20.8% | 22.4% |
| Standard Deviation (Population) | 20.4% | 22.1% |
Similar Demographics by Births to Unmarried Women
Demographics Similar to Maltese by Births to Unmarried Women
In terms of births to unmarried women, the demographic groups most similar to Maltese are Immigrants from Greece (27.8%, a difference of 0.12%), Macedonian (27.9%, a difference of 0.13%), Bhutanese (27.9%, a difference of 0.17%), Immigrants from Romania (27.9%, a difference of 0.19%), and Afghan (27.9%, a difference of 0.25%).
| Demographics | Rating | Rank | Births to Unmarried Women |
| Immigrants | Bulgaria | 99.6 /100 | #43 | Exceptional 27.6% |
| Immigrants | Indonesia | 99.5 /100 | #44 | Exceptional 27.7% |
| Latvians | 99.5 /100 | #45 | Exceptional 27.7% |
| Immigrants | Lithuania | 99.5 /100 | #46 | Exceptional 27.7% |
| Hmong | 99.5 /100 | #47 | Exceptional 27.7% |
| Eastern Europeans | 99.5 /100 | #48 | Exceptional 27.7% |
| Immigrants | Greece | 99.4 /100 | #49 | Exceptional 27.8% |
| Maltese | 99.4 /100 | #50 | Exceptional 27.8% |
| Macedonians | 99.4 /100 | #51 | Exceptional 27.9% |
| Bhutanese | 99.4 /100 | #52 | Exceptional 27.9% |
| Immigrants | Romania | 99.4 /100 | #53 | Exceptional 27.9% |
| Afghans | 99.4 /100 | #54 | Exceptional 27.9% |
| Mongolians | 99.3 /100 | #55 | Exceptional 27.9% |
| Immigrants | Belgium | 99.3 /100 | #56 | Exceptional 28.0% |
| Russians | 99.2 /100 | #57 | Exceptional 28.0% |
Demographics Similar to Carpatho Rusyns by Births to Unmarried Women
In terms of births to unmarried women, the demographic groups most similar to Carpatho Rusyns are Immigrants from Bangladesh (30.9%, a difference of 0.050%), Immigrants from Eastern Africa (31.0%, a difference of 0.17%), Yugoslavian (30.8%, a difference of 0.20%), British (30.8%, a difference of 0.32%), and Polish (30.8%, a difference of 0.34%).
| Demographics | Rating | Rank | Births to Unmarried Women |
| Serbians | 78.8 /100 | #149 | Good 30.7% |
| Somalis | 77.8 /100 | #150 | Good 30.7% |
| Italians | 77.0 /100 | #151 | Good 30.8% |
| Poles | 76.2 /100 | #152 | Good 30.8% |
| British | 76.0 /100 | #153 | Good 30.8% |
| Yugoslavians | 75.1 /100 | #154 | Good 30.8% |
| Immigrants | Bangladesh | 73.9 /100 | #155 | Good 30.9% |
| Carpatho Rusyns | 73.5 /100 | #156 | Good 30.9% |
| Immigrants | Eastern Africa | 72.1 /100 | #157 | Good 31.0% |
| Austrians | 69.9 /100 | #158 | Good 31.0% |
| Immigrants | England | 69.4 /100 | #159 | Good 31.1% |
| Immigrants | Western Europe | 69.3 /100 | #160 | Good 31.1% |
| Immigrants | Southern Europe | 68.7 /100 | #161 | Good 31.1% |
| Slovenes | 65.9 /100 | #162 | Good 31.2% |
| Immigrants | Chile | 65.7 /100 | #163 | Good 31.2% |