Luxembourger vs Malaysian Currently Married
COMPARE
Luxembourger
Malaysian
Currently Married
Currently Married Comparison
Luxembourgers
Malaysians
49.3%
CURRENTLY MARRIED
99.8/ 100
METRIC RATING
20th/ 347
METRIC RANK
45.9%
CURRENTLY MARRIED
15.3/ 100
METRIC RATING
201st/ 347
METRIC RANK
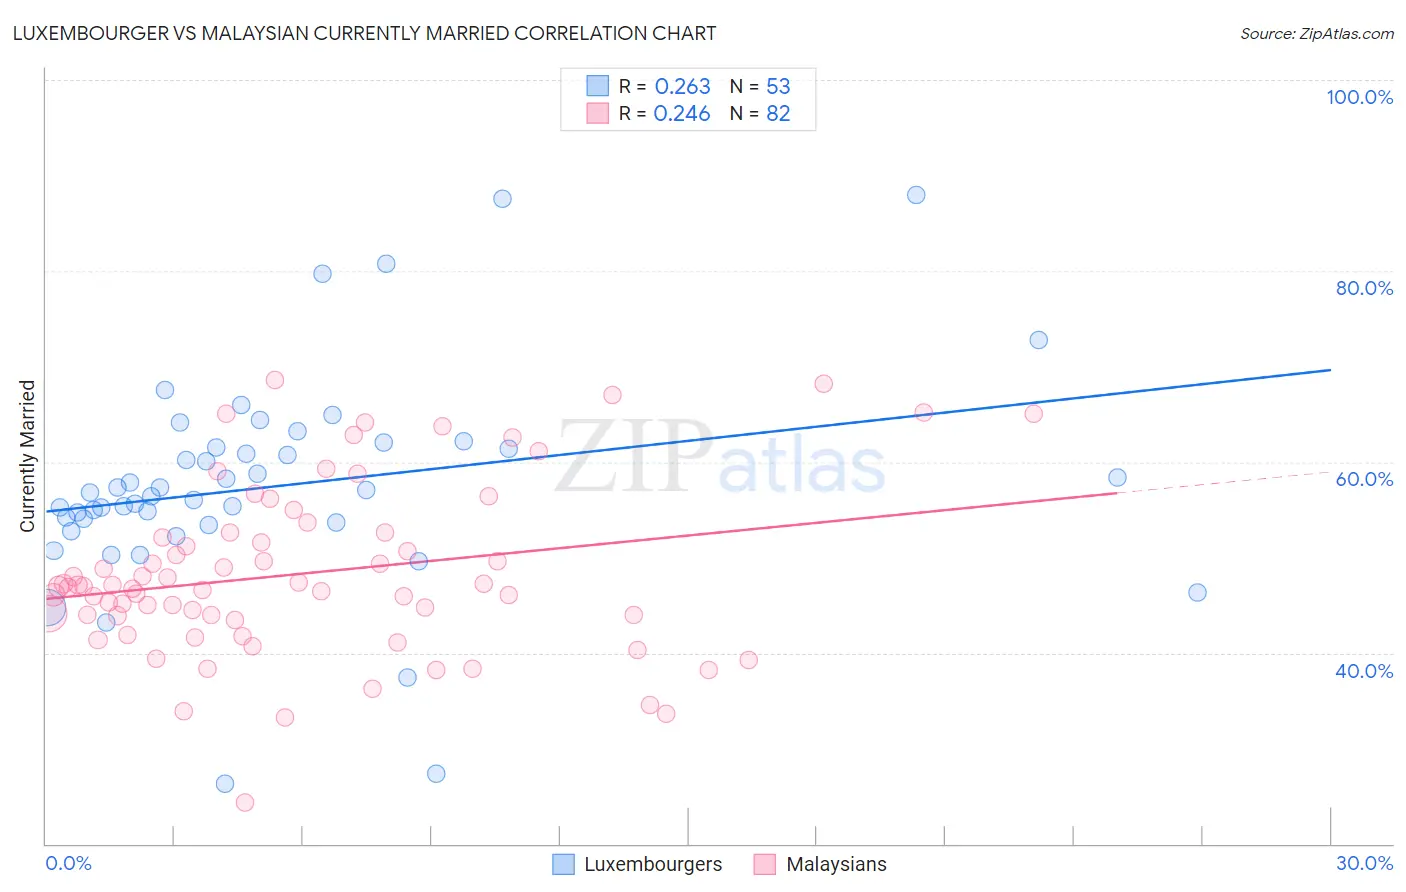
Luxembourger vs Malaysian Currently Married Correlation Chart
The statistical analysis conducted on geographies consisting of 144,673,478 people shows a weak positive correlation between the proportion of Luxembourgers and percentage of population currently married in the United States with a correlation coefficient (R) of 0.263 and weighted average of 49.3%. Similarly, the statistical analysis conducted on geographies consisting of 226,093,582 people shows a weak positive correlation between the proportion of Malaysians and percentage of population currently married in the United States with a correlation coefficient (R) of 0.246 and weighted average of 45.9%, a difference of 7.3%.
Currently Married Correlation Summary
| Measurement | Luxembourger | Malaysian |
| Minimum | 26.3% | 24.3% |
| Maximum | 88.0% | 68.6% |
| Range | 61.7% | 44.3% |
| Mean | 57.5% | 48.3% |
| Median | 56.7% | 46.9% |
| Interquartile 25% (IQ1) | 53.5% | 43.9% |
| Interquartile 75% (IQ3) | 61.7% | 52.6% |
| Interquartile Range (IQR) | 8.2% | 8.7% |
| Standard Deviation (Sample) | 11.4% | 8.9% |
| Standard Deviation (Population) | 11.2% | 8.9% |
Similar Demographics by Currently Married
Demographics Similar to Luxembourgers by Currently Married
In terms of currently married, the demographic groups most similar to Luxembourgers are Scottish (49.2%, a difference of 0.11%), European (49.3%, a difference of 0.14%), Immigrants from Scotland (49.3%, a difference of 0.15%), Bulgarian (49.1%, a difference of 0.33%), and Scandinavian (49.5%, a difference of 0.44%).
| Demographics | Rating | Rank | Currently Married |
| Dutch | 99.9 /100 | #13 | Exceptional 49.6% |
| Germans | 99.9 /100 | #14 | Exceptional 49.6% |
| Pennsylvania Germans | 99.9 /100 | #15 | Exceptional 49.6% |
| Chinese | 99.9 /100 | #16 | Exceptional 49.5% |
| Scandinavians | 99.9 /100 | #17 | Exceptional 49.5% |
| Immigrants | Scotland | 99.8 /100 | #18 | Exceptional 49.3% |
| Europeans | 99.8 /100 | #19 | Exceptional 49.3% |
| Luxembourgers | 99.8 /100 | #20 | Exceptional 49.3% |
| Scottish | 99.8 /100 | #21 | Exceptional 49.2% |
| Bulgarians | 99.7 /100 | #22 | Exceptional 49.1% |
| Immigrants | Pakistan | 99.7 /100 | #23 | Exceptional 49.1% |
| Lithuanians | 99.6 /100 | #24 | Exceptional 49.0% |
| Maltese | 99.6 /100 | #25 | Exceptional 49.0% |
| Immigrants | Korea | 99.6 /100 | #26 | Exceptional 49.0% |
| Burmese | 99.6 /100 | #27 | Exceptional 48.9% |
Demographics Similar to Malaysians by Currently Married
In terms of currently married, the demographic groups most similar to Malaysians are Immigrants from Albania (45.9%, a difference of 0.060%), Creek (46.0%, a difference of 0.13%), Immigrants from Costa Rica (46.0%, a difference of 0.27%), Taiwanese (45.8%, a difference of 0.29%), and Immigrants from Spain (45.8%, a difference of 0.30%).
| Demographics | Rating | Rank | Currently Married |
| South Americans | 23.8 /100 | #194 | Fair 46.1% |
| Immigrants | Nepal | 23.7 /100 | #195 | Fair 46.1% |
| Immigrants | Bosnia and Herzegovina | 22.2 /100 | #196 | Fair 46.1% |
| Immigrants | Kuwait | 21.7 /100 | #197 | Fair 46.1% |
| Immigrants | Colombia | 21.0 /100 | #198 | Fair 46.1% |
| Immigrants | Costa Rica | 19.6 /100 | #199 | Poor 46.0% |
| Creek | 17.2 /100 | #200 | Poor 46.0% |
| Malaysians | 15.3 /100 | #201 | Poor 45.9% |
| Immigrants | Albania | 14.5 /100 | #202 | Poor 45.9% |
| Taiwanese | 11.7 /100 | #203 | Poor 45.8% |
| Immigrants | Spain | 11.6 /100 | #204 | Poor 45.8% |
| South American Indians | 11.5 /100 | #205 | Poor 45.8% |
| Immigrants | Immigrants | 11.2 /100 | #206 | Poor 45.8% |
| Immigrants | South America | 10.8 /100 | #207 | Poor 45.7% |
| Alsatians | 10.8 /100 | #208 | Poor 45.7% |