Lumbee vs Immigrants from Yemen Unemployment Among Ages 20 to 24 years
COMPARE
Lumbee
Immigrants from Yemen
Unemployment Among Ages 20 to 24 years
Unemployment Among Ages 20 to 24 years Comparison
Lumbee
Immigrants from Yemen
12.0%
UNEMPLOYMENT AMONG AGES 20 TO 24 YEARS
0.0/ 100
METRIC RATING
298th/ 347
METRIC RANK
14.9%
UNEMPLOYMENT AMONG AGES 20 TO 24 YEARS
0.0/ 100
METRIC RATING
339th/ 347
METRIC RANK
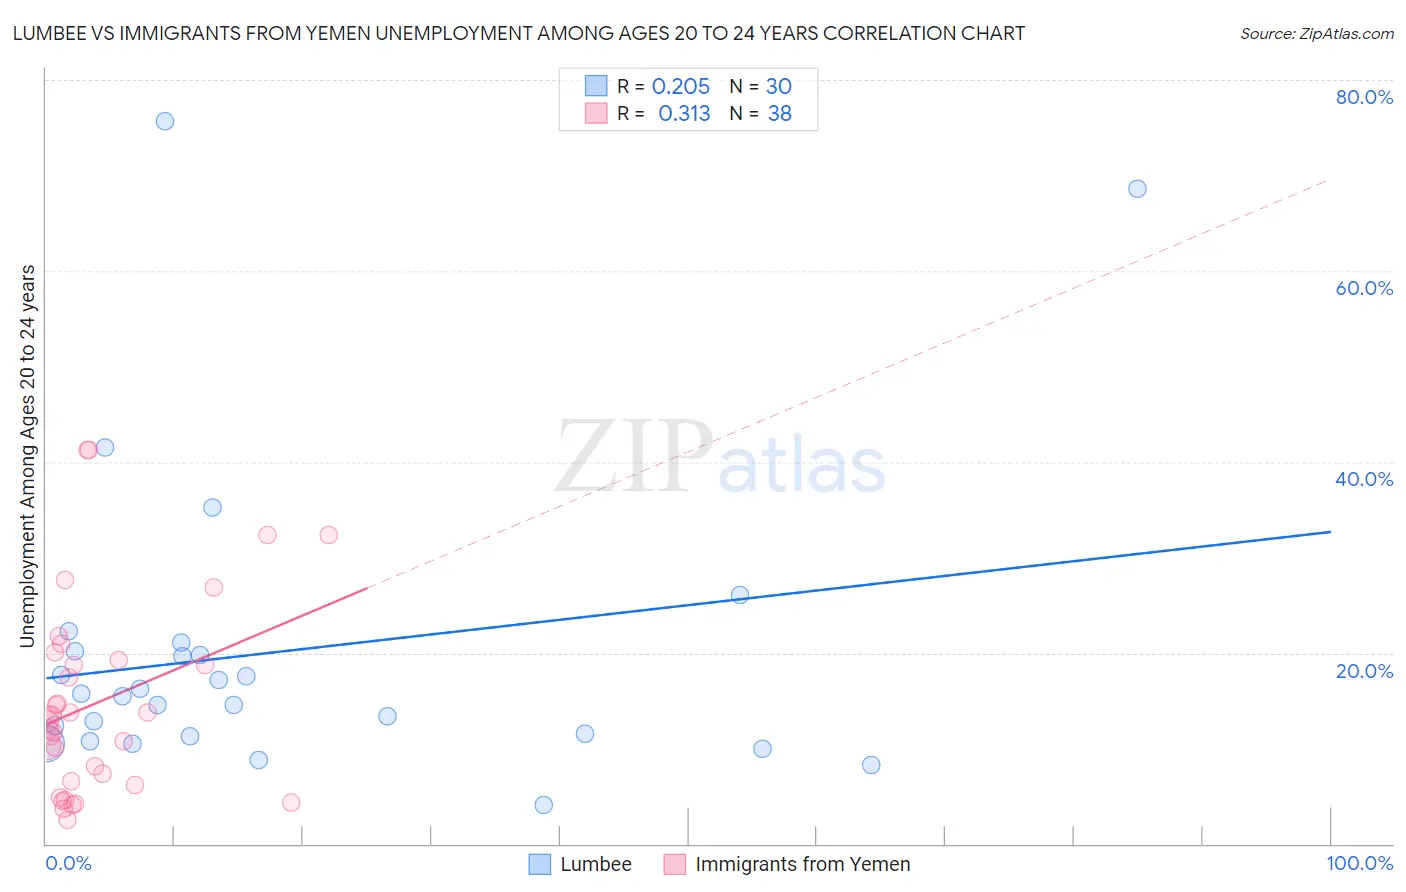
Lumbee vs Immigrants from Yemen Unemployment Among Ages 20 to 24 years Correlation Chart
The statistical analysis conducted on geographies consisting of 91,069,259 people shows a weak positive correlation between the proportion of Lumbee and unemployment rate among population between the ages 20 and 24 in the United States with a correlation coefficient (R) of 0.205 and weighted average of 12.0%. Similarly, the statistical analysis conducted on geographies consisting of 82,154,441 people shows a mild positive correlation between the proportion of Immigrants from Yemen and unemployment rate among population between the ages 20 and 24 in the United States with a correlation coefficient (R) of 0.313 and weighted average of 14.9%, a difference of 23.7%.
Unemployment Among Ages 20 to 24 years Correlation Summary
| Measurement | Lumbee | Immigrants from Yemen |
| Minimum | 4.0% | 2.5% |
| Maximum | 75.7% | 41.3% |
| Range | 71.7% | 38.8% |
| Mean | 20.1% | 14.8% |
| Median | 15.5% | 13.1% |
| Interquartile 25% (IQ1) | 11.3% | 6.5% |
| Interquartile 75% (IQ3) | 20.2% | 19.3% |
| Interquartile Range (IQR) | 8.9% | 12.8% |
| Standard Deviation (Sample) | 16.1% | 10.1% |
| Standard Deviation (Population) | 15.8% | 10.0% |
Similar Demographics by Unemployment Among Ages 20 to 24 years
Demographics Similar to Lumbee by Unemployment Among Ages 20 to 24 years
In terms of unemployment among ages 20 to 24 years, the demographic groups most similar to Lumbee are Apache (12.0%, a difference of 0.030%), Spanish American Indian (12.1%, a difference of 0.19%), Blackfeet (12.0%, a difference of 0.45%), Cajun (12.0%, a difference of 0.47%), and Immigrants from Armenia (12.0%, a difference of 0.50%).
| Demographics | Rating | Rank | Unemployment Among Ages 20 to 24 years |
| Central American Indians | 0.0 /100 | #291 | Tragic 11.9% |
| Immigrants | Senegal | 0.0 /100 | #292 | Tragic 11.9% |
| Immigrants | Ghana | 0.0 /100 | #293 | Tragic 11.9% |
| Immigrants | Belize | 0.0 /100 | #294 | Tragic 12.0% |
| Immigrants | Armenia | 0.0 /100 | #295 | Tragic 12.0% |
| Cajuns | 0.0 /100 | #296 | Tragic 12.0% |
| Blackfeet | 0.0 /100 | #297 | Tragic 12.0% |
| Lumbee | 0.0 /100 | #298 | Tragic 12.0% |
| Apache | 0.0 /100 | #299 | Tragic 12.0% |
| Spanish American Indians | 0.0 /100 | #300 | Tragic 12.1% |
| Immigrants | Sierra Leone | 0.0 /100 | #301 | Tragic 12.1% |
| Immigrants | Cabo Verde | 0.0 /100 | #302 | Tragic 12.2% |
| Haitians | 0.0 /100 | #303 | Tragic 12.2% |
| Immigrants | West Indies | 0.0 /100 | #304 | Tragic 12.3% |
| Chippewa | 0.0 /100 | #305 | Tragic 12.3% |
Demographics Similar to Immigrants from Yemen by Unemployment Among Ages 20 to 24 years
In terms of unemployment among ages 20 to 24 years, the demographic groups most similar to Immigrants from Yemen are Immigrants from St. Vincent and the Grenadines (14.3%, a difference of 3.8%), Paiute (14.3%, a difference of 3.8%), Pima (14.2%, a difference of 4.9%), Sioux (14.2%, a difference of 5.1%), and Yuman (15.8%, a difference of 6.4%).
| Demographics | Rating | Rank | Unemployment Among Ages 20 to 24 years |
| Immigrants | Grenada | 0.0 /100 | #332 | Tragic 13.8% |
| Immigrants | Guyana | 0.0 /100 | #333 | Tragic 13.9% |
| Guyanese | 0.0 /100 | #334 | Tragic 14.0% |
| Sioux | 0.0 /100 | #335 | Tragic 14.2% |
| Pima | 0.0 /100 | #336 | Tragic 14.2% |
| Paiute | 0.0 /100 | #337 | Tragic 14.3% |
| Immigrants | St. Vincent and the Grenadines | 0.0 /100 | #338 | Tragic 14.3% |
| Immigrants | Yemen | 0.0 /100 | #339 | Tragic 14.9% |
| Yuman | 0.0 /100 | #340 | Tragic 15.8% |
| Navajo | 0.0 /100 | #341 | Tragic 16.1% |
| Puerto Ricans | 0.0 /100 | #342 | Tragic 16.7% |
| Tsimshian | 0.0 /100 | #343 | Tragic 18.0% |
| Crow | 0.0 /100 | #344 | Tragic 18.7% |
| Hopi | 0.0 /100 | #345 | Tragic 19.9% |
| Yup'ik | 0.0 /100 | #346 | Tragic 20.9% |