Immigrants from Peru vs Vietnamese Average Family Size
COMPARE
Immigrants from Peru
Vietnamese
Average Family Size
Average Family Size Comparison
Immigrants from Peru
Vietnamese
3.31
AVERAGE FAMILY SIZE
99.7/ 100
METRIC RATING
87th/ 347
METRIC RANK
3.37
AVERAGE FAMILY SIZE
100.0/ 100
METRIC RATING
47th/ 347
METRIC RANK
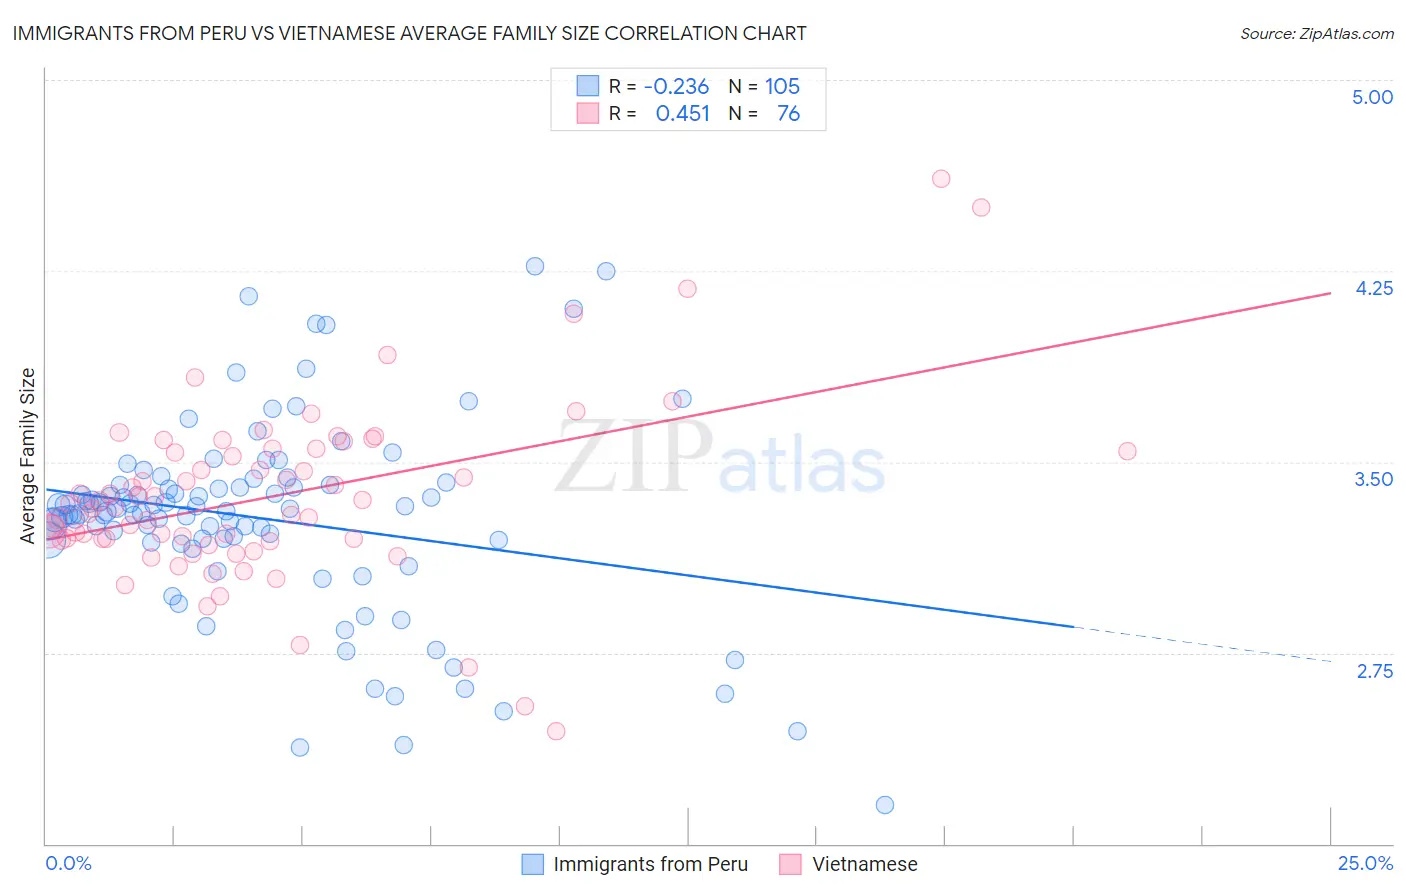
Immigrants from Peru vs Vietnamese Average Family Size Correlation Chart
The statistical analysis conducted on geographies consisting of 328,761,601 people shows a weak negative correlation between the proportion of Immigrants from Peru and average family size in the United States with a correlation coefficient (R) of -0.236 and weighted average of 3.31. Similarly, the statistical analysis conducted on geographies consisting of 170,658,830 people shows a moderate positive correlation between the proportion of Vietnamese and average family size in the United States with a correlation coefficient (R) of 0.451 and weighted average of 3.37, a difference of 1.8%.
Average Family Size Correlation Summary
| Measurement | Immigrants from Peru | Vietnamese |
| Minimum | 2.15 | 2.44 |
| Maximum | 4.27 | 4.61 |
| Range | 2.12 | 2.17 |
| Mean | 3.28 | 3.36 |
| Median | 3.31 | 3.33 |
| Interquartile 25% (IQ1) | 3.19 | 3.20 |
| Interquartile 75% (IQ3) | 3.41 | 3.54 |
| Interquartile Range (IQR) | 0.22 | 0.35 |
| Standard Deviation (Sample) | 0.38 | 0.35 |
| Standard Deviation (Population) | 0.38 | 0.35 |
Similar Demographics by Average Family Size
Demographics Similar to Immigrants from Peru by Average Family Size
In terms of average family size, the demographic groups most similar to Immigrants from Peru are Jamaican (3.31, a difference of 0.050%), Afghan (3.31, a difference of 0.070%), Immigrants from Bolivia (3.31, a difference of 0.090%), Malaysian (3.31, a difference of 0.10%), and Immigrants from Nigeria (3.32, a difference of 0.12%).
| Demographics | Rating | Rank | Average Family Size |
| Lumbee | 99.8 /100 | #80 | Exceptional 3.32 |
| Immigrants | Dominica | 99.8 /100 | #81 | Exceptional 3.32 |
| Ecuadorians | 99.8 /100 | #82 | Exceptional 3.32 |
| Immigrants | Afghanistan | 99.8 /100 | #83 | Exceptional 3.32 |
| Immigrants | Nigeria | 99.7 /100 | #84 | Exceptional 3.32 |
| Afghans | 99.7 /100 | #85 | Exceptional 3.31 |
| Jamaicans | 99.7 /100 | #86 | Exceptional 3.31 |
| Immigrants | Peru | 99.7 /100 | #87 | Exceptional 3.31 |
| Immigrants | Bolivia | 99.6 /100 | #88 | Exceptional 3.31 |
| Malaysians | 99.6 /100 | #89 | Exceptional 3.31 |
| Menominee | 99.4 /100 | #90 | Exceptional 3.30 |
| Immigrants | Pakistan | 99.2 /100 | #91 | Exceptional 3.30 |
| Immigrants | Cameroon | 99.2 /100 | #92 | Exceptional 3.30 |
| Peruvians | 99.2 /100 | #93 | Exceptional 3.30 |
| Sierra Leoneans | 99.0 /100 | #94 | Exceptional 3.30 |
Demographics Similar to Vietnamese by Average Family Size
In terms of average family size, the demographic groups most similar to Vietnamese are Immigrants from Nicaragua (3.37, a difference of 0.0%), Haitian (3.37, a difference of 0.040%), Bangladeshi (3.37, a difference of 0.070%), Shoshone (3.37, a difference of 0.10%), and Alaska Native (3.37, a difference of 0.13%).
| Demographics | Rating | Rank | Average Family Size |
| Belizeans | 100.0 /100 | #40 | Exceptional 3.39 |
| Marshallese | 100.0 /100 | #41 | Exceptional 3.38 |
| Immigrants | Vietnam | 100.0 /100 | #42 | Exceptional 3.38 |
| Immigrants | Philippines | 100.0 /100 | #43 | Exceptional 3.37 |
| Alaska Natives | 100.0 /100 | #44 | Exceptional 3.37 |
| Shoshone | 100.0 /100 | #45 | Exceptional 3.37 |
| Haitians | 100.0 /100 | #46 | Exceptional 3.37 |
| Vietnamese | 100.0 /100 | #47 | Exceptional 3.37 |
| Immigrants | Nicaragua | 100.0 /100 | #48 | Exceptional 3.37 |
| Bangladeshis | 100.0 /100 | #49 | Exceptional 3.37 |
| Immigrants | Bangladesh | 100.0 /100 | #50 | Exceptional 3.36 |
| Nicaraguans | 100.0 /100 | #51 | Exceptional 3.36 |
| Fijians | 100.0 /100 | #52 | Exceptional 3.36 |
| Koreans | 100.0 /100 | #53 | Exceptional 3.36 |
| Immigrants | South Eastern Asia | 100.0 /100 | #54 | Exceptional 3.36 |