Afghan vs Scotch-Irish Family Households
COMPARE
Afghan
Scotch-Irish
Family Households
Family Households Comparison
Afghans
Scotch-Irish
66.3%
FAMILY HOUSEHOLDS
100.0/ 100
METRIC RATING
53rd/ 347
METRIC RANK
64.4%
FAMILY HOUSEHOLDS
59.2/ 100
METRIC RATING
166th/ 347
METRIC RANK
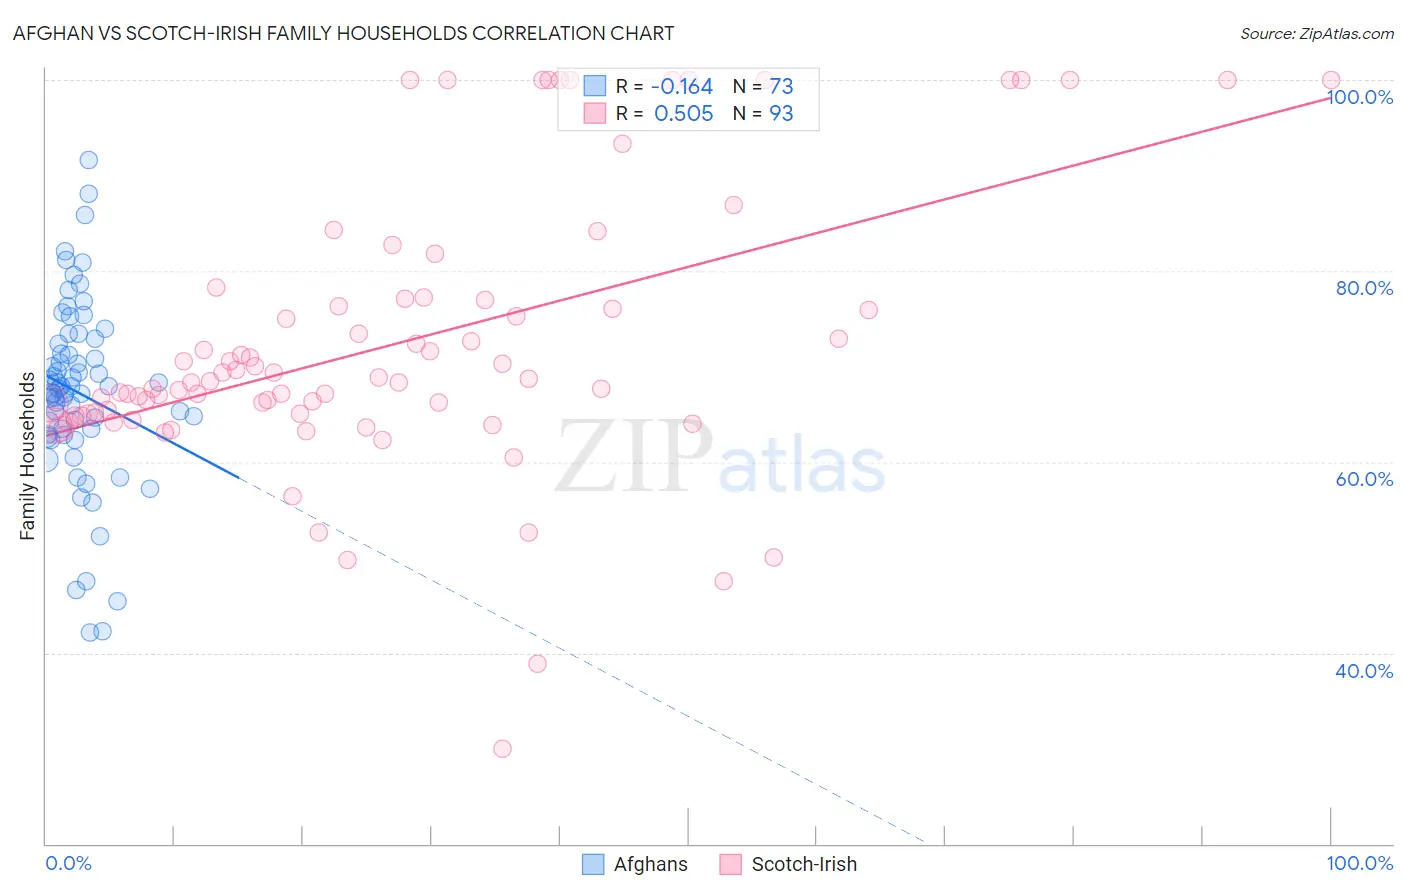
Afghan vs Scotch-Irish Family Households Correlation Chart
The statistical analysis conducted on geographies consisting of 148,833,722 people shows a poor negative correlation between the proportion of Afghans and percentage of family households in the United States with a correlation coefficient (R) of -0.164 and weighted average of 66.3%. Similarly, the statistical analysis conducted on geographies consisting of 548,372,963 people shows a substantial positive correlation between the proportion of Scotch-Irish and percentage of family households in the United States with a correlation coefficient (R) of 0.505 and weighted average of 64.4%, a difference of 2.9%.
Family Households Correlation Summary
| Measurement | Afghan | Scotch-Irish |
| Minimum | 42.2% | 29.9% |
| Maximum | 91.7% | 100.0% |
| Range | 49.5% | 70.1% |
| Mean | 67.2% | 72.5% |
| Median | 67.7% | 68.4% |
| Interquartile 25% (IQ1) | 62.8% | 64.9% |
| Interquartile 75% (IQ3) | 72.6% | 77.0% |
| Interquartile Range (IQR) | 9.8% | 12.1% |
| Standard Deviation (Sample) | 9.6% | 14.6% |
| Standard Deviation (Population) | 9.6% | 14.5% |
Similar Demographics by Family Households
Demographics Similar to Afghans by Family Households
In terms of family households, the demographic groups most similar to Afghans are Immigrants from Colombia (66.3%, a difference of 0.0%), Colombian (66.3%, a difference of 0.010%), Native/Alaskan (66.4%, a difference of 0.14%), Navajo (66.4%, a difference of 0.17%), and Immigrants (66.1%, a difference of 0.17%).
| Demographics | Rating | Rank | Family Households |
| Arapaho | 100.0 /100 | #46 | Exceptional 66.5% |
| Bolivians | 100.0 /100 | #47 | Exceptional 66.5% |
| Immigrants | Venezuela | 100.0 /100 | #48 | Exceptional 66.4% |
| Immigrants | South Central Asia | 100.0 /100 | #49 | Exceptional 66.4% |
| Navajo | 100.0 /100 | #50 | Exceptional 66.4% |
| Natives/Alaskans | 100.0 /100 | #51 | Exceptional 66.4% |
| Colombians | 100.0 /100 | #52 | Exceptional 66.3% |
| Afghans | 100.0 /100 | #53 | Exceptional 66.3% |
| Immigrants | Colombia | 100.0 /100 | #54 | Exceptional 66.3% |
| Immigrants | Immigrants | 100.0 /100 | #55 | Exceptional 66.1% |
| Immigrants | Hong Kong | 100.0 /100 | #56 | Exceptional 66.1% |
| Pennsylvania Germans | 100.0 /100 | #57 | Exceptional 66.1% |
| Immigrants | Asia | 100.0 /100 | #58 | Exceptional 66.1% |
| Immigrants | Korea | 100.0 /100 | #59 | Exceptional 66.0% |
| South Americans | 100.0 /100 | #60 | Exceptional 66.0% |
Demographics Similar to Scotch-Irish by Family Households
In terms of family households, the demographic groups most similar to Scotch-Irish are Immigrants from Nigeria (64.4%, a difference of 0.010%), Immigrants from Southern Europe (64.4%, a difference of 0.010%), Irish (64.4%, a difference of 0.020%), Honduran (64.4%, a difference of 0.020%), and British (64.4%, a difference of 0.030%).
| Demographics | Rating | Rank | Family Households |
| Germans | 65.8 /100 | #159 | Good 64.4% |
| Immigrants | Moldova | 65.2 /100 | #160 | Good 64.4% |
| Immigrants | England | 62.6 /100 | #161 | Good 64.4% |
| British | 61.6 /100 | #162 | Good 64.4% |
| Chickasaw | 61.5 /100 | #163 | Good 64.4% |
| Immigrants | Nigeria | 60.1 /100 | #164 | Good 64.4% |
| Immigrants | Southern Europe | 60.0 /100 | #165 | Good 64.4% |
| Scotch-Irish | 59.2 /100 | #166 | Average 64.4% |
| Irish | 57.9 /100 | #167 | Average 64.4% |
| Hondurans | 57.5 /100 | #168 | Average 64.4% |
| Iraqis | 56.0 /100 | #169 | Average 64.4% |
| Armenians | 55.9 /100 | #170 | Average 64.4% |
| Ute | 54.6 /100 | #171 | Average 64.3% |
| Dutch West Indians | 53.9 /100 | #172 | Average 64.3% |
| Immigrants | Sierra Leone | 52.5 /100 | #173 | Average 64.3% |