Liberian vs Tohono O'odham Married-couple Households
COMPARE
Liberian
Tohono O'odham
Married-couple Households
Married-couple Households Comparison
Liberians
Tohono O'odham
40.7%
MARRIED-COUPLE HOUSEHOLDS
0.0/ 100
METRIC RATING
318th/ 347
METRIC RANK
37.9%
MARRIED-COUPLE HOUSEHOLDS
0.0/ 100
METRIC RATING
342nd/ 347
METRIC RANK
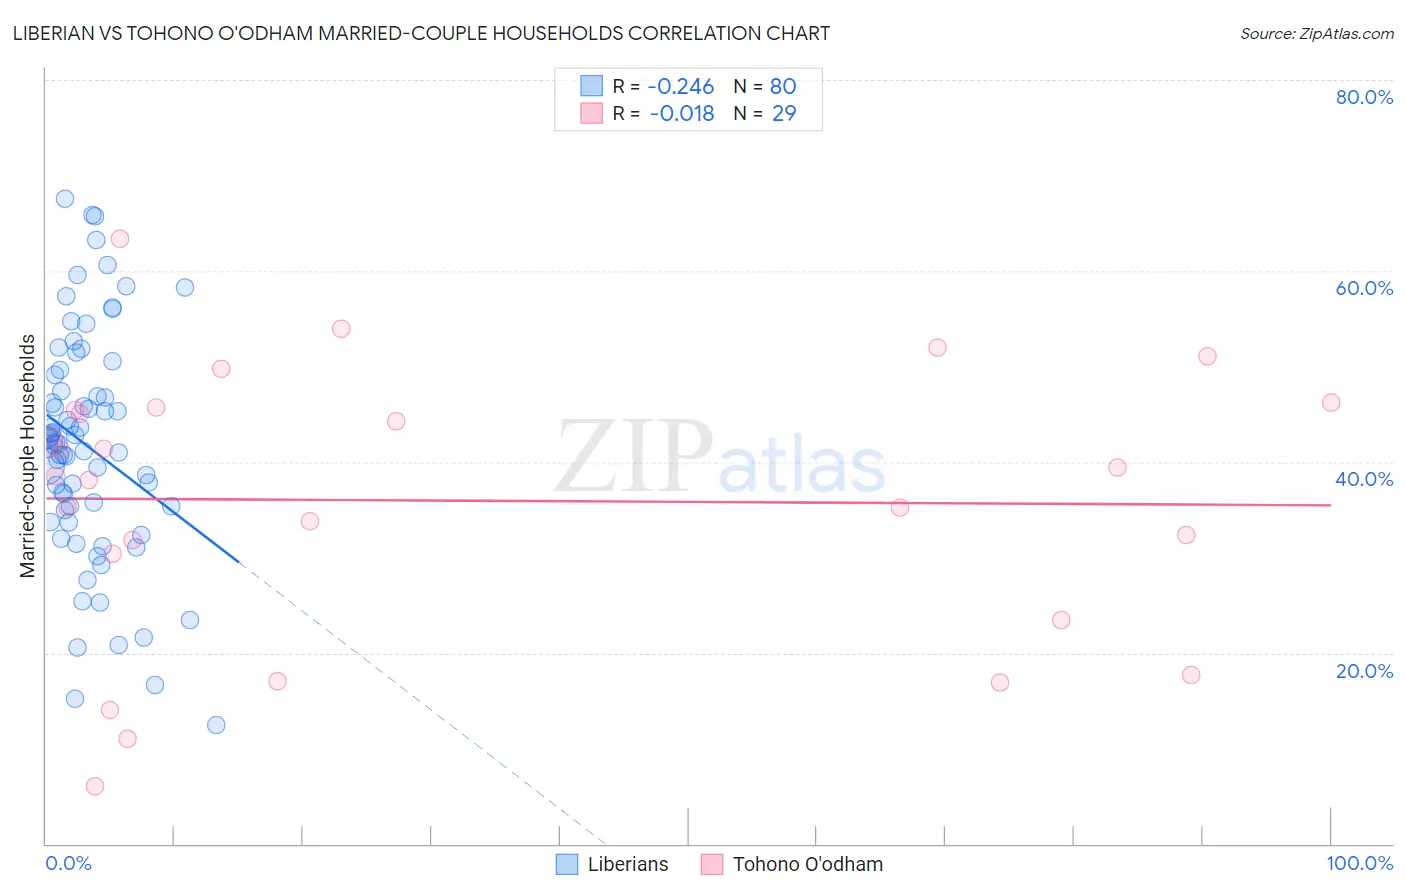
Liberian vs Tohono O'odham Married-couple Households Correlation Chart
The statistical analysis conducted on geographies consisting of 118,032,066 people shows a weak negative correlation between the proportion of Liberians and percentage of married-couple family households in the United States with a correlation coefficient (R) of -0.246 and weighted average of 40.7%. Similarly, the statistical analysis conducted on geographies consisting of 58,718,357 people shows no correlation between the proportion of Tohono O'odham and percentage of married-couple family households in the United States with a correlation coefficient (R) of -0.018 and weighted average of 37.9%, a difference of 7.3%.
Married-couple Households Correlation Summary
| Measurement | Liberian | Tohono O'odham |
| Minimum | 12.5% | 6.1% |
| Maximum | 67.6% | 63.4% |
| Range | 55.1% | 57.3% |
| Mean | 41.7% | 35.9% |
| Median | 42.0% | 38.5% |
| Interquartile 25% (IQ1) | 35.1% | 26.9% |
| Interquartile 75% (IQ3) | 48.2% | 45.6% |
| Interquartile Range (IQR) | 13.1% | 18.7% |
| Standard Deviation (Sample) | 11.9% | 14.1% |
| Standard Deviation (Population) | 11.8% | 13.9% |
Similar Demographics by Married-couple Households
Demographics Similar to Liberians by Married-couple Households
In terms of married-couple households, the demographic groups most similar to Liberians are Immigrants from Jamaica (40.7%, a difference of 0.010%), Immigrants from Caribbean (40.8%, a difference of 0.30%), Bahamian (40.5%, a difference of 0.35%), Trinidadian and Tobagonian (40.9%, a difference of 0.48%), and Jamaican (40.9%, a difference of 0.56%).
| Demographics | Rating | Rank | Married-couple Households |
| Colville | 0.0 /100 | #311 | Tragic 41.0% |
| Africans | 0.0 /100 | #312 | Tragic 40.9% |
| Immigrants | Haiti | 0.0 /100 | #313 | Tragic 40.9% |
| Jamaicans | 0.0 /100 | #314 | Tragic 40.9% |
| Trinidadians and Tobagonians | 0.0 /100 | #315 | Tragic 40.9% |
| Immigrants | Caribbean | 0.0 /100 | #316 | Tragic 40.8% |
| Immigrants | Jamaica | 0.0 /100 | #317 | Tragic 40.7% |
| Liberians | 0.0 /100 | #318 | Tragic 40.7% |
| Bahamians | 0.0 /100 | #319 | Tragic 40.5% |
| West Indians | 0.0 /100 | #320 | Tragic 40.3% |
| Immigrants | Liberia | 0.0 /100 | #321 | Tragic 40.3% |
| Immigrants | Zaire | 0.0 /100 | #322 | Tragic 40.1% |
| Puerto Ricans | 0.0 /100 | #323 | Tragic 40.1% |
| Navajo | 0.0 /100 | #324 | Tragic 40.1% |
| Pueblo | 0.0 /100 | #325 | Tragic 40.0% |
Demographics Similar to Tohono O'odham by Married-couple Households
In terms of married-couple households, the demographic groups most similar to Tohono O'odham are Cape Verdean (38.1%, a difference of 0.60%), Dominican (38.2%, a difference of 0.73%), Immigrants from Grenada (37.5%, a difference of 1.1%), British West Indian (38.3%, a difference of 1.1%), and Immigrants from Senegal (38.4%, a difference of 1.2%).
| Demographics | Rating | Rank | Married-couple Households |
| Immigrants | West Indies | 0.0 /100 | #333 | Tragic 39.0% |
| Immigrants | St. Vincent and the Grenadines | 0.0 /100 | #334 | Tragic 38.7% |
| Senegalese | 0.0 /100 | #335 | Tragic 38.6% |
| Blacks/African Americans | 0.0 /100 | #336 | Tragic 38.5% |
| Immigrants | Somalia | 0.0 /100 | #337 | Tragic 38.4% |
| Immigrants | Senegal | 0.0 /100 | #338 | Tragic 38.4% |
| British West Indians | 0.0 /100 | #339 | Tragic 38.3% |
| Dominicans | 0.0 /100 | #340 | Tragic 38.2% |
| Cape Verdeans | 0.0 /100 | #341 | Tragic 38.1% |
| Tohono O'odham | 0.0 /100 | #342 | Tragic 37.9% |
| Immigrants | Grenada | 0.0 /100 | #343 | Tragic 37.5% |
| Immigrants | Dominican Republic | 0.0 /100 | #344 | Tragic 37.3% |
| Hopi | 0.0 /100 | #345 | Tragic 36.7% |
| Immigrants | Cabo Verde | 0.0 /100 | #346 | Tragic 36.2% |
| Pima | 0.0 /100 | #347 | Tragic 35.6% |