Immigrants from Egypt vs Tohono O'odham Married-couple Households
COMPARE
Immigrants from Egypt
Tohono O'odham
Married-couple Households
Married-couple Households Comparison
Immigrants from Egypt
Tohono O'odham
47.9%
MARRIED-COUPLE HOUSEHOLDS
96.6/ 100
METRIC RATING
96th/ 347
METRIC RANK
37.9%
MARRIED-COUPLE HOUSEHOLDS
0.0/ 100
METRIC RATING
342nd/ 347
METRIC RANK
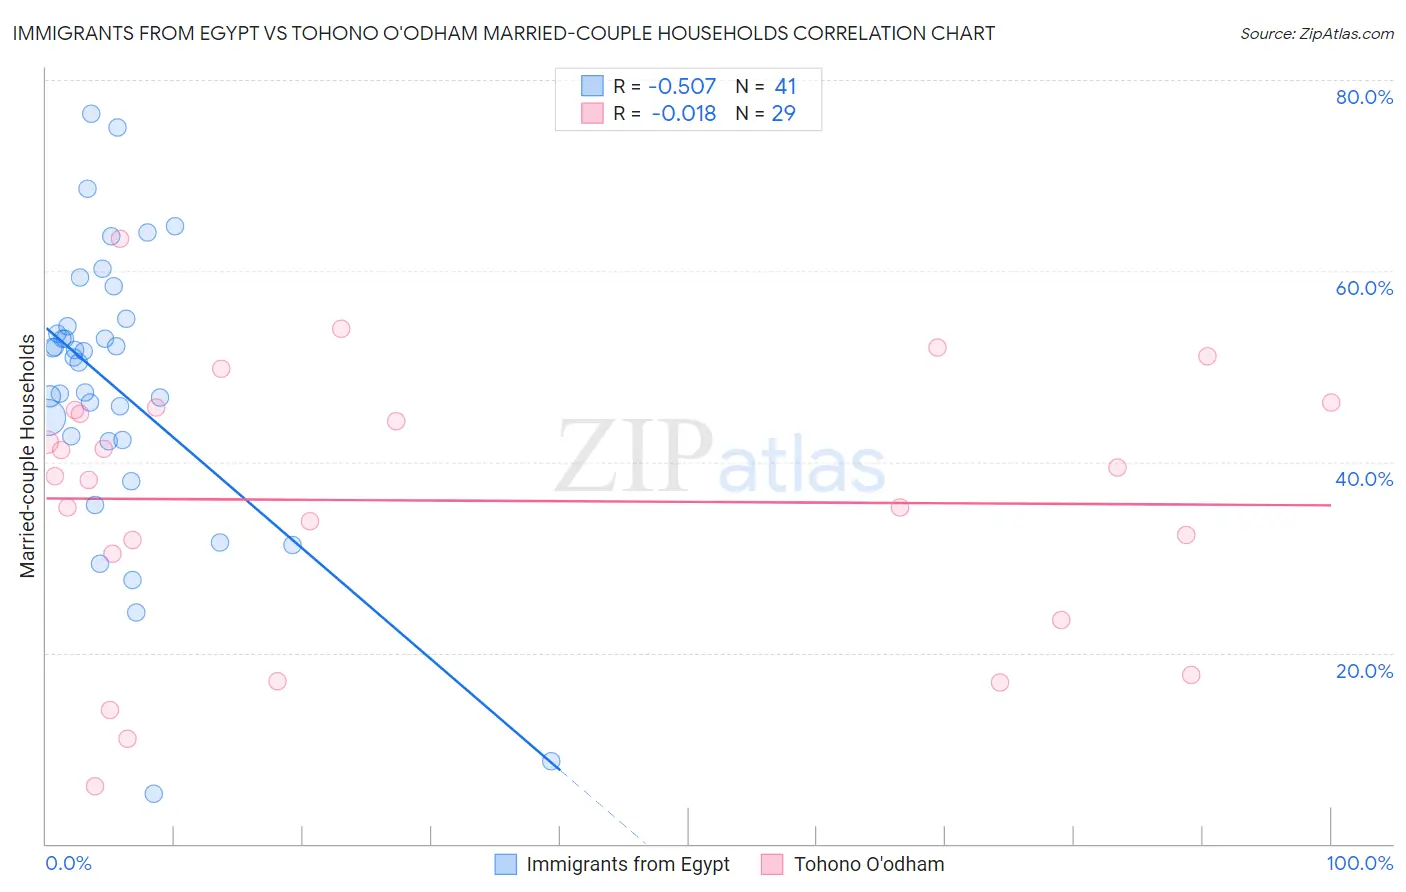
Immigrants from Egypt vs Tohono O'odham Married-couple Households Correlation Chart
The statistical analysis conducted on geographies consisting of 245,425,004 people shows a substantial negative correlation between the proportion of Immigrants from Egypt and percentage of married-couple family households in the United States with a correlation coefficient (R) of -0.507 and weighted average of 47.9%. Similarly, the statistical analysis conducted on geographies consisting of 58,718,357 people shows no correlation between the proportion of Tohono O'odham and percentage of married-couple family households in the United States with a correlation coefficient (R) of -0.018 and weighted average of 37.9%, a difference of 26.4%.
Married-couple Households Correlation Summary
| Measurement | Immigrants from Egypt | Tohono O'odham |
| Minimum | 5.3% | 6.1% |
| Maximum | 76.5% | 63.4% |
| Range | 71.2% | 57.3% |
| Mean | 47.7% | 35.9% |
| Median | 51.0% | 38.5% |
| Interquartile 25% (IQ1) | 42.2% | 26.9% |
| Interquartile 75% (IQ3) | 54.6% | 45.6% |
| Interquartile Range (IQR) | 12.3% | 18.7% |
| Standard Deviation (Sample) | 15.0% | 14.1% |
| Standard Deviation (Population) | 14.8% | 13.9% |
Similar Demographics by Married-couple Households
Demographics Similar to Immigrants from Egypt by Married-couple Households
In terms of married-couple households, the demographic groups most similar to Immigrants from Egypt are Latvian (47.9%, a difference of 0.030%), Immigrants from North Macedonia (47.9%, a difference of 0.040%), Immigrants from Belgium (47.9%, a difference of 0.050%), Immigrants from Austria (47.9%, a difference of 0.050%), and Immigrants from Italy (47.9%, a difference of 0.060%).
| Demographics | Rating | Rank | Married-couple Households |
| Cypriots | 97.2 /100 | #89 | Exceptional 48.0% |
| French | 97.2 /100 | #90 | Exceptional 48.0% |
| Immigrants | Moldova | 97.0 /100 | #91 | Exceptional 48.0% |
| Palestinians | 96.9 /100 | #92 | Exceptional 48.0% |
| Lebanese | 96.9 /100 | #93 | Exceptional 47.9% |
| Americans | 96.9 /100 | #94 | Exceptional 47.9% |
| Immigrants | Belgium | 96.8 /100 | #95 | Exceptional 47.9% |
| Immigrants | Egypt | 96.6 /100 | #96 | Exceptional 47.9% |
| Latvians | 96.5 /100 | #97 | Exceptional 47.9% |
| Immigrants | North Macedonia | 96.4 /100 | #98 | Exceptional 47.9% |
| Immigrants | Austria | 96.4 /100 | #99 | Exceptional 47.9% |
| Immigrants | Italy | 96.3 /100 | #100 | Exceptional 47.9% |
| Turks | 96.1 /100 | #101 | Exceptional 47.8% |
| Slavs | 96.0 /100 | #102 | Exceptional 47.8% |
| Hawaiians | 96.0 /100 | #103 | Exceptional 47.8% |
Demographics Similar to Tohono O'odham by Married-couple Households
In terms of married-couple households, the demographic groups most similar to Tohono O'odham are Cape Verdean (38.1%, a difference of 0.60%), Dominican (38.2%, a difference of 0.73%), Immigrants from Grenada (37.5%, a difference of 1.1%), British West Indian (38.3%, a difference of 1.1%), and Immigrants from Senegal (38.4%, a difference of 1.2%).
| Demographics | Rating | Rank | Married-couple Households |
| Immigrants | West Indies | 0.0 /100 | #333 | Tragic 39.0% |
| Immigrants | St. Vincent and the Grenadines | 0.0 /100 | #334 | Tragic 38.7% |
| Senegalese | 0.0 /100 | #335 | Tragic 38.6% |
| Blacks/African Americans | 0.0 /100 | #336 | Tragic 38.5% |
| Immigrants | Somalia | 0.0 /100 | #337 | Tragic 38.4% |
| Immigrants | Senegal | 0.0 /100 | #338 | Tragic 38.4% |
| British West Indians | 0.0 /100 | #339 | Tragic 38.3% |
| Dominicans | 0.0 /100 | #340 | Tragic 38.2% |
| Cape Verdeans | 0.0 /100 | #341 | Tragic 38.1% |
| Tohono O'odham | 0.0 /100 | #342 | Tragic 37.9% |
| Immigrants | Grenada | 0.0 /100 | #343 | Tragic 37.5% |
| Immigrants | Dominican Republic | 0.0 /100 | #344 | Tragic 37.3% |
| Hopi | 0.0 /100 | #345 | Tragic 36.7% |
| Immigrants | Cabo Verde | 0.0 /100 | #346 | Tragic 36.2% |
| Pima | 0.0 /100 | #347 | Tragic 35.6% |