Lebanese vs Immigrants from Senegal Divorced or Separated
COMPARE
Lebanese
Immigrants from Senegal
Divorced or Separated
Divorced or Separated Comparison
Lebanese
Immigrants from Senegal
11.9%
DIVORCED OR SEPARATED
83.4/ 100
METRIC RATING
140th/ 347
METRIC RANK
12.6%
DIVORCED OR SEPARATED
0.5/ 100
METRIC RATING
265th/ 347
METRIC RANK
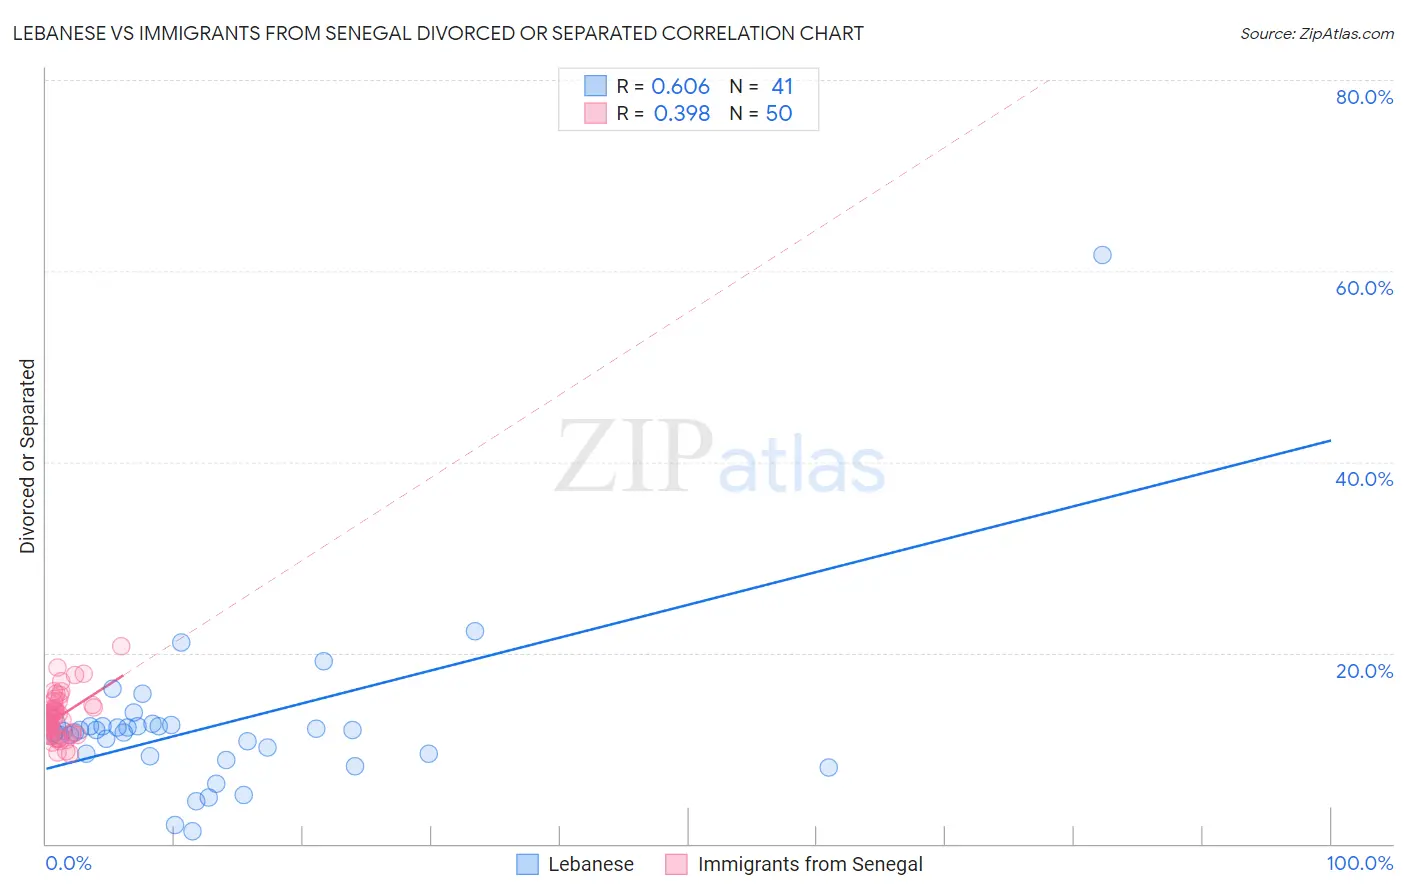
Lebanese vs Immigrants from Senegal Divorced or Separated Correlation Chart
The statistical analysis conducted on geographies consisting of 401,417,076 people shows a significant positive correlation between the proportion of Lebanese and percentage of population currently divorced or separated in the United States with a correlation coefficient (R) of 0.606 and weighted average of 11.9%. Similarly, the statistical analysis conducted on geographies consisting of 90,108,226 people shows a mild positive correlation between the proportion of Immigrants from Senegal and percentage of population currently divorced or separated in the United States with a correlation coefficient (R) of 0.398 and weighted average of 12.6%, a difference of 6.1%.
Divorced or Separated Correlation Summary
| Measurement | Lebanese | Immigrants from Senegal |
| Minimum | 1.3% | 9.4% |
| Maximum | 61.7% | 20.7% |
| Range | 60.4% | 11.3% |
| Mean | 12.4% | 13.4% |
| Median | 11.8% | 13.2% |
| Interquartile 25% (IQ1) | 9.2% | 11.5% |
| Interquartile 75% (IQ3) | 12.3% | 14.5% |
| Interquartile Range (IQR) | 3.1% | 3.0% |
| Standard Deviation (Sample) | 9.0% | 2.4% |
| Standard Deviation (Population) | 8.9% | 2.4% |
Similar Demographics by Divorced or Separated
Demographics Similar to Lebanese by Divorced or Separated
In terms of divorced or separated, the demographic groups most similar to Lebanese are Australian (11.9%, a difference of 0.020%), Immigrants from Netherlands (11.9%, a difference of 0.030%), Immigrants from Morocco (11.9%, a difference of 0.030%), Alsatian (11.9%, a difference of 0.040%), and Carpatho Rusyn (11.9%, a difference of 0.090%).
| Demographics | Rating | Rank | Divorced or Separated |
| New Zealanders | 87.5 /100 | #133 | Excellent 11.9% |
| Argentineans | 85.1 /100 | #134 | Excellent 11.9% |
| Danes | 84.8 /100 | #135 | Excellent 11.9% |
| Carpatho Rusyns | 84.8 /100 | #136 | Excellent 11.9% |
| Alsatians | 84.0 /100 | #137 | Excellent 11.9% |
| Immigrants | Netherlands | 83.9 /100 | #138 | Excellent 11.9% |
| Australians | 83.6 /100 | #139 | Excellent 11.9% |
| Lebanese | 83.4 /100 | #140 | Excellent 11.9% |
| Immigrants | Morocco | 82.9 /100 | #141 | Excellent 11.9% |
| Immigrants | Zimbabwe | 81.5 /100 | #142 | Excellent 11.9% |
| Pakistanis | 81.3 /100 | #143 | Excellent 11.9% |
| Peruvians | 80.9 /100 | #144 | Excellent 11.9% |
| Croatians | 80.6 /100 | #145 | Excellent 11.9% |
| Immigrants | Grenada | 79.1 /100 | #146 | Good 11.9% |
| Poles | 78.6 /100 | #147 | Good 11.9% |
Demographics Similar to Immigrants from Senegal by Divorced or Separated
In terms of divorced or separated, the demographic groups most similar to Immigrants from Senegal are White/Caucasian (12.6%, a difference of 0.010%), English (12.6%, a difference of 0.020%), Immigrants from Panama (12.6%, a difference of 0.030%), Scottish (12.6%, a difference of 0.050%), and Fijian (12.6%, a difference of 0.070%).
| Demographics | Rating | Rank | Divorced or Separated |
| Indonesians | 0.6 /100 | #258 | Tragic 12.6% |
| Yuman | 0.6 /100 | #259 | Tragic 12.6% |
| Immigrants | Uruguay | 0.6 /100 | #260 | Tragic 12.6% |
| Immigrants | Dominica | 0.5 /100 | #261 | Tragic 12.6% |
| Basques | 0.5 /100 | #262 | Tragic 12.6% |
| Immigrants | Panama | 0.5 /100 | #263 | Tragic 12.6% |
| English | 0.5 /100 | #264 | Tragic 12.6% |
| Immigrants | Senegal | 0.5 /100 | #265 | Tragic 12.6% |
| Whites/Caucasians | 0.5 /100 | #266 | Tragic 12.6% |
| Scottish | 0.4 /100 | #267 | Tragic 12.6% |
| Fijians | 0.4 /100 | #268 | Tragic 12.6% |
| Immigrants | Liberia | 0.4 /100 | #269 | Tragic 12.6% |
| Ute | 0.4 /100 | #270 | Tragic 12.6% |
| Panamanians | 0.3 /100 | #271 | Tragic 12.7% |
| Immigrants | Middle Africa | 0.3 /100 | #272 | Tragic 12.7% |