Lebanese vs Puget Sound Salish Divorced or Separated
COMPARE
Lebanese
Puget Sound Salish
Divorced or Separated
Divorced or Separated Comparison
Lebanese
Puget Sound Salish
11.9%
DIVORCED OR SEPARATED
83.4/ 100
METRIC RATING
140th/ 347
METRIC RANK
13.4%
DIVORCED OR SEPARATED
0.0/ 100
METRIC RATING
319th/ 347
METRIC RANK
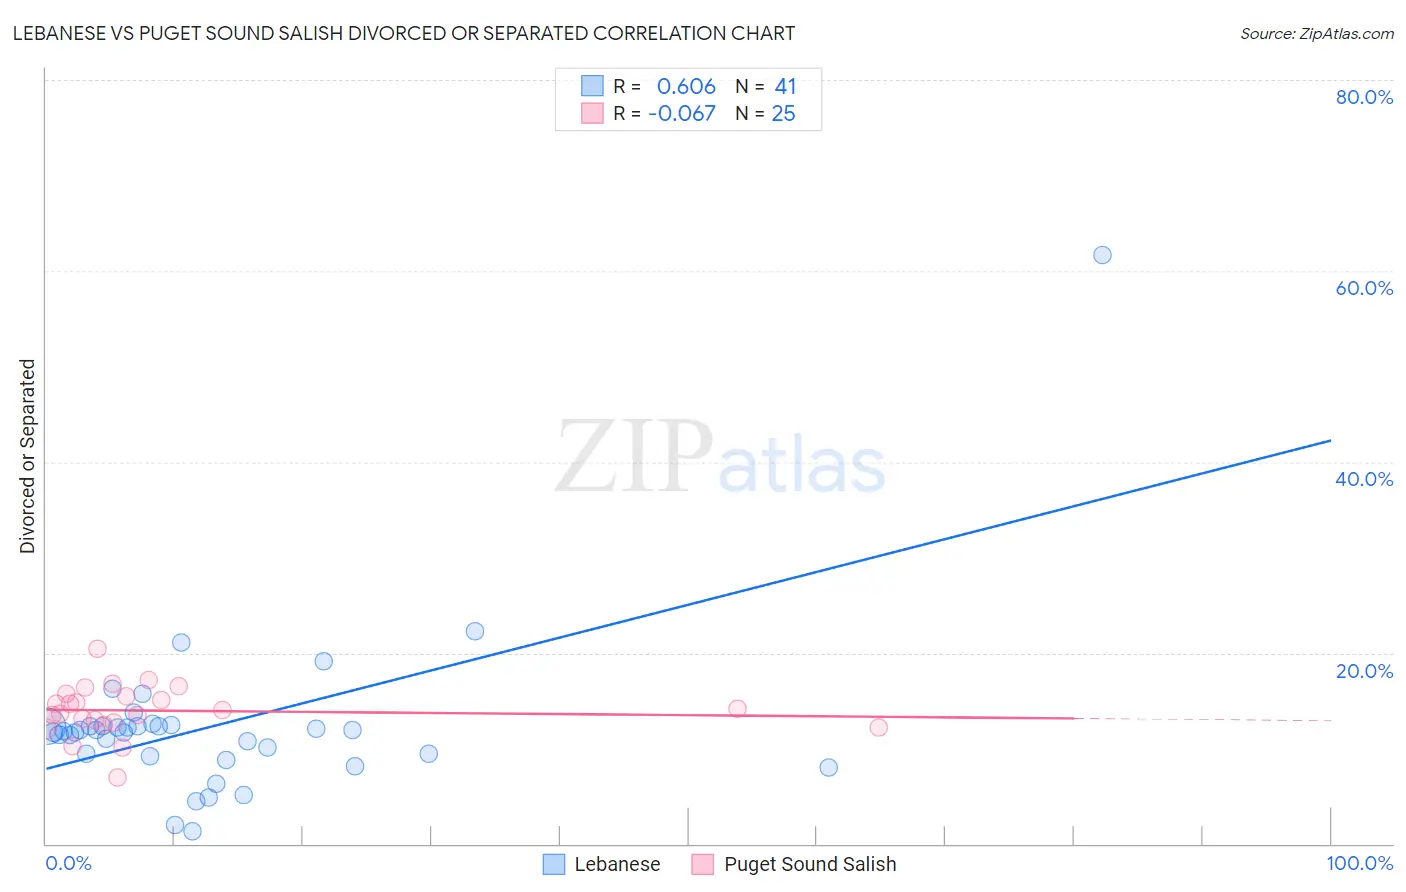
Lebanese vs Puget Sound Salish Divorced or Separated Correlation Chart
The statistical analysis conducted on geographies consisting of 401,417,076 people shows a significant positive correlation between the proportion of Lebanese and percentage of population currently divorced or separated in the United States with a correlation coefficient (R) of 0.606 and weighted average of 11.9%. Similarly, the statistical analysis conducted on geographies consisting of 46,155,746 people shows a slight negative correlation between the proportion of Puget Sound Salish and percentage of population currently divorced or separated in the United States with a correlation coefficient (R) of -0.067 and weighted average of 13.4%, a difference of 12.4%.
Divorced or Separated Correlation Summary
| Measurement | Lebanese | Puget Sound Salish |
| Minimum | 1.3% | 6.9% |
| Maximum | 61.7% | 20.4% |
| Range | 60.4% | 13.5% |
| Mean | 12.4% | 13.9% |
| Median | 11.8% | 14.0% |
| Interquartile 25% (IQ1) | 9.2% | 12.5% |
| Interquartile 75% (IQ3) | 12.3% | 15.6% |
| Interquartile Range (IQR) | 3.1% | 3.0% |
| Standard Deviation (Sample) | 9.0% | 2.7% |
| Standard Deviation (Population) | 8.9% | 2.6% |
Similar Demographics by Divorced or Separated
Demographics Similar to Lebanese by Divorced or Separated
In terms of divorced or separated, the demographic groups most similar to Lebanese are Australian (11.9%, a difference of 0.020%), Immigrants from Netherlands (11.9%, a difference of 0.030%), Immigrants from Morocco (11.9%, a difference of 0.030%), Alsatian (11.9%, a difference of 0.040%), and Carpatho Rusyn (11.9%, a difference of 0.090%).
| Demographics | Rating | Rank | Divorced or Separated |
| New Zealanders | 87.5 /100 | #133 | Excellent 11.9% |
| Argentineans | 85.1 /100 | #134 | Excellent 11.9% |
| Danes | 84.8 /100 | #135 | Excellent 11.9% |
| Carpatho Rusyns | 84.8 /100 | #136 | Excellent 11.9% |
| Alsatians | 84.0 /100 | #137 | Excellent 11.9% |
| Immigrants | Netherlands | 83.9 /100 | #138 | Excellent 11.9% |
| Australians | 83.6 /100 | #139 | Excellent 11.9% |
| Lebanese | 83.4 /100 | #140 | Excellent 11.9% |
| Immigrants | Morocco | 82.9 /100 | #141 | Excellent 11.9% |
| Immigrants | Zimbabwe | 81.5 /100 | #142 | Excellent 11.9% |
| Pakistanis | 81.3 /100 | #143 | Excellent 11.9% |
| Peruvians | 80.9 /100 | #144 | Excellent 11.9% |
| Croatians | 80.6 /100 | #145 | Excellent 11.9% |
| Immigrants | Grenada | 79.1 /100 | #146 | Good 11.9% |
| Poles | 78.6 /100 | #147 | Good 11.9% |
Demographics Similar to Puget Sound Salish by Divorced or Separated
In terms of divorced or separated, the demographic groups most similar to Puget Sound Salish are Cree (13.4%, a difference of 0.040%), Haitian (13.3%, a difference of 0.060%), Cajun (13.4%, a difference of 0.060%), Tsimshian (13.3%, a difference of 0.080%), and Spanish American (13.3%, a difference of 0.12%).
| Demographics | Rating | Rank | Divorced or Separated |
| Blackfeet | 0.0 /100 | #312 | Tragic 13.3% |
| Immigrants | Nicaragua | 0.0 /100 | #313 | Tragic 13.3% |
| Yaqui | 0.0 /100 | #314 | Tragic 13.3% |
| Spanish Americans | 0.0 /100 | #315 | Tragic 13.3% |
| Tsimshian | 0.0 /100 | #316 | Tragic 13.3% |
| Haitians | 0.0 /100 | #317 | Tragic 13.3% |
| Cree | 0.0 /100 | #318 | Tragic 13.4% |
| Puget Sound Salish | 0.0 /100 | #319 | Tragic 13.4% |
| Cajuns | 0.0 /100 | #320 | Tragic 13.4% |
| Cheyenne | 0.0 /100 | #321 | Tragic 13.4% |
| Immigrants | Haiti | 0.0 /100 | #322 | Tragic 13.4% |
| U.S. Virgin Islanders | 0.0 /100 | #323 | Tragic 13.4% |
| Osage | 0.0 /100 | #324 | Tragic 13.4% |
| Potawatomi | 0.0 /100 | #325 | Tragic 13.5% |
| Immigrants | Congo | 0.0 /100 | #326 | Tragic 13.5% |