Haitian vs Immigrants from Vietnam Divorced or Separated
COMPARE
Haitian
Immigrants from Vietnam
Divorced or Separated
Divorced or Separated Comparison
Haitians
Immigrants from Vietnam
13.3%
DIVORCED OR SEPARATED
0.0/ 100
METRIC RATING
317th/ 347
METRIC RANK
11.3%
DIVORCED OR SEPARATED
99.9/ 100
METRIC RATING
57th/ 347
METRIC RANK
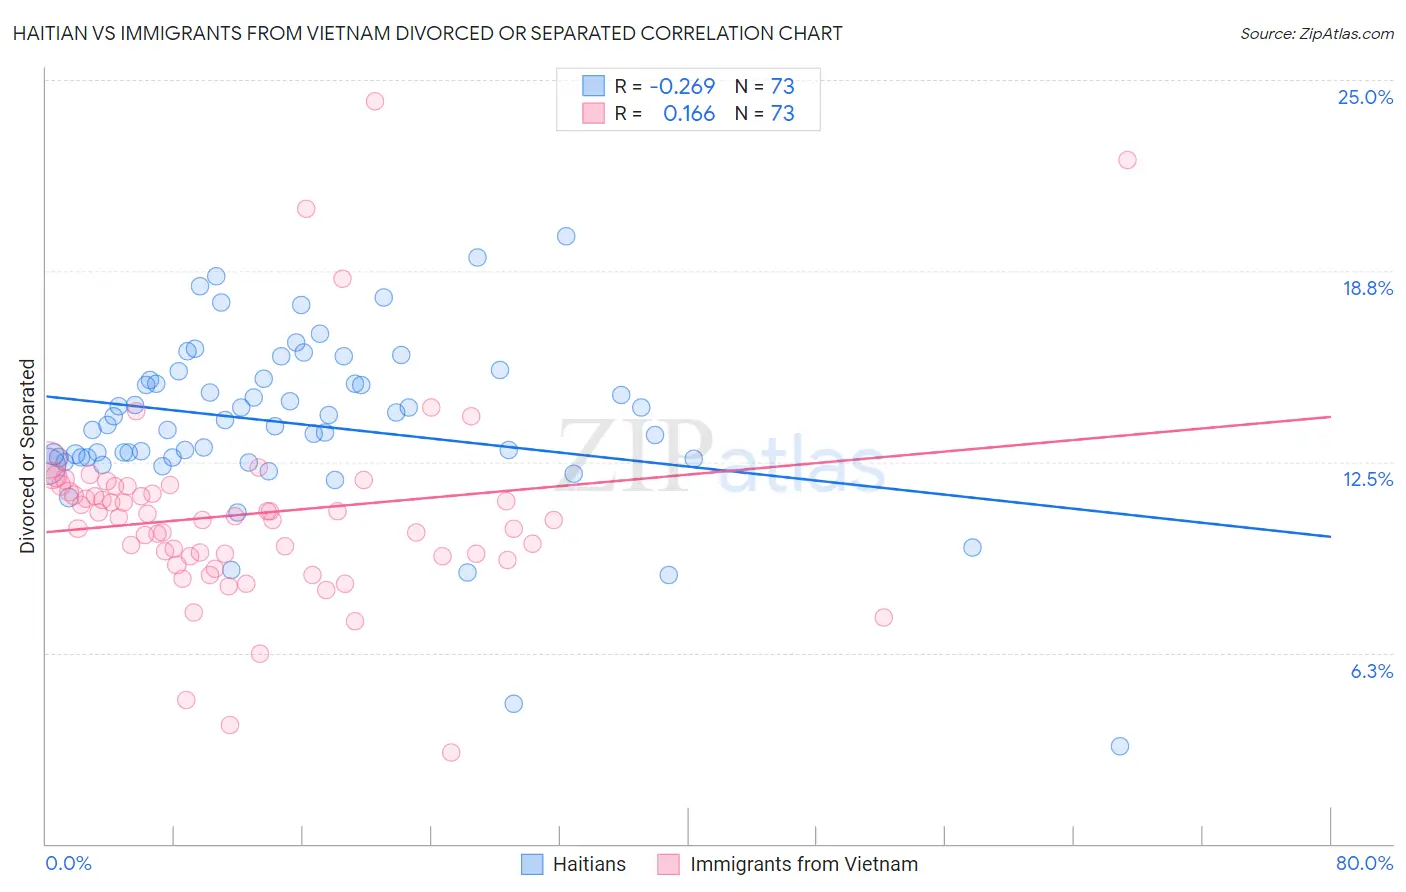
Haitian vs Immigrants from Vietnam Divorced or Separated Correlation Chart
The statistical analysis conducted on geographies consisting of 287,822,437 people shows a weak negative correlation between the proportion of Haitians and percentage of population currently divorced or separated in the United States with a correlation coefficient (R) of -0.269 and weighted average of 13.3%. Similarly, the statistical analysis conducted on geographies consisting of 404,667,518 people shows a poor positive correlation between the proportion of Immigrants from Vietnam and percentage of population currently divorced or separated in the United States with a correlation coefficient (R) of 0.166 and weighted average of 11.3%, a difference of 18.0%.
Divorced or Separated Correlation Summary
| Measurement | Haitian | Immigrants from Vietnam |
| Minimum | 3.2% | 3.0% |
| Maximum | 19.9% | 24.3% |
| Range | 16.7% | 21.3% |
| Mean | 13.8% | 10.8% |
| Median | 13.7% | 10.7% |
| Interquartile 25% (IQ1) | 12.6% | 9.4% |
| Interquartile 75% (IQ3) | 15.2% | 11.7% |
| Interquartile Range (IQR) | 2.6% | 2.3% |
| Standard Deviation (Sample) | 2.8% | 3.3% |
| Standard Deviation (Population) | 2.8% | 3.3% |
Similar Demographics by Divorced or Separated
Demographics Similar to Haitians by Divorced or Separated
In terms of divorced or separated, the demographic groups most similar to Haitians are Tsimshian (13.3%, a difference of 0.020%), Cree (13.4%, a difference of 0.030%), Spanish American (13.3%, a difference of 0.050%), Puget Sound Salish (13.4%, a difference of 0.060%), and Cajun (13.4%, a difference of 0.12%).
| Demographics | Rating | Rank | Divorced or Separated |
| Africans | 0.0 /100 | #310 | Tragic 13.2% |
| Sioux | 0.0 /100 | #311 | Tragic 13.2% |
| Blackfeet | 0.0 /100 | #312 | Tragic 13.3% |
| Immigrants | Nicaragua | 0.0 /100 | #313 | Tragic 13.3% |
| Yaqui | 0.0 /100 | #314 | Tragic 13.3% |
| Spanish Americans | 0.0 /100 | #315 | Tragic 13.3% |
| Tsimshian | 0.0 /100 | #316 | Tragic 13.3% |
| Haitians | 0.0 /100 | #317 | Tragic 13.3% |
| Cree | 0.0 /100 | #318 | Tragic 13.4% |
| Puget Sound Salish | 0.0 /100 | #319 | Tragic 13.4% |
| Cajuns | 0.0 /100 | #320 | Tragic 13.4% |
| Cheyenne | 0.0 /100 | #321 | Tragic 13.4% |
| Immigrants | Haiti | 0.0 /100 | #322 | Tragic 13.4% |
| U.S. Virgin Islanders | 0.0 /100 | #323 | Tragic 13.4% |
| Osage | 0.0 /100 | #324 | Tragic 13.4% |
Demographics Similar to Immigrants from Vietnam by Divorced or Separated
In terms of divorced or separated, the demographic groups most similar to Immigrants from Vietnam are Immigrants from Philippines (11.3%, a difference of 0.010%), Sri Lankan (11.3%, a difference of 0.060%), Immigrants from Yemen (11.3%, a difference of 0.070%), Eastern European (11.3%, a difference of 0.080%), and Israeli (11.3%, a difference of 0.16%).
| Demographics | Rating | Rank | Divorced or Separated |
| Bolivians | 100.0 /100 | #50 | Exceptional 11.2% |
| Immigrants | Bolivia | 100.0 /100 | #51 | Exceptional 11.3% |
| Immigrants | Australia | 99.9 /100 | #52 | Exceptional 11.3% |
| Immigrants | Lithuania | 99.9 /100 | #53 | Exceptional 11.3% |
| Eastern Europeans | 99.9 /100 | #54 | Exceptional 11.3% |
| Immigrants | Yemen | 99.9 /100 | #55 | Exceptional 11.3% |
| Immigrants | Philippines | 99.9 /100 | #56 | Exceptional 11.3% |
| Immigrants | Vietnam | 99.9 /100 | #57 | Exceptional 11.3% |
| Sri Lankans | 99.9 /100 | #58 | Exceptional 11.3% |
| Israelis | 99.9 /100 | #59 | Exceptional 11.3% |
| Immigrants | Russia | 99.9 /100 | #60 | Exceptional 11.3% |
| Koreans | 99.9 /100 | #61 | Exceptional 11.3% |
| Luxembourgers | 99.9 /100 | #62 | Exceptional 11.3% |
| Immigrants | Kuwait | 99.9 /100 | #63 | Exceptional 11.3% |
| Macedonians | 99.8 /100 | #64 | Exceptional 11.4% |