Immigrants from South Africa vs Immigrants from Turkey Single Mother Households
COMPARE
Immigrants from South Africa
Immigrants from Turkey
Single Mother Households
Single Mother Households Comparison
Immigrants from South Africa
Immigrants from Turkey
5.7%
SINGLE MOTHER HOUSEHOLDS
96.3/ 100
METRIC RATING
98th/ 347
METRIC RANK
5.7%
SINGLE MOTHER HOUSEHOLDS
97.5/ 100
METRIC RATING
87th/ 347
METRIC RANK
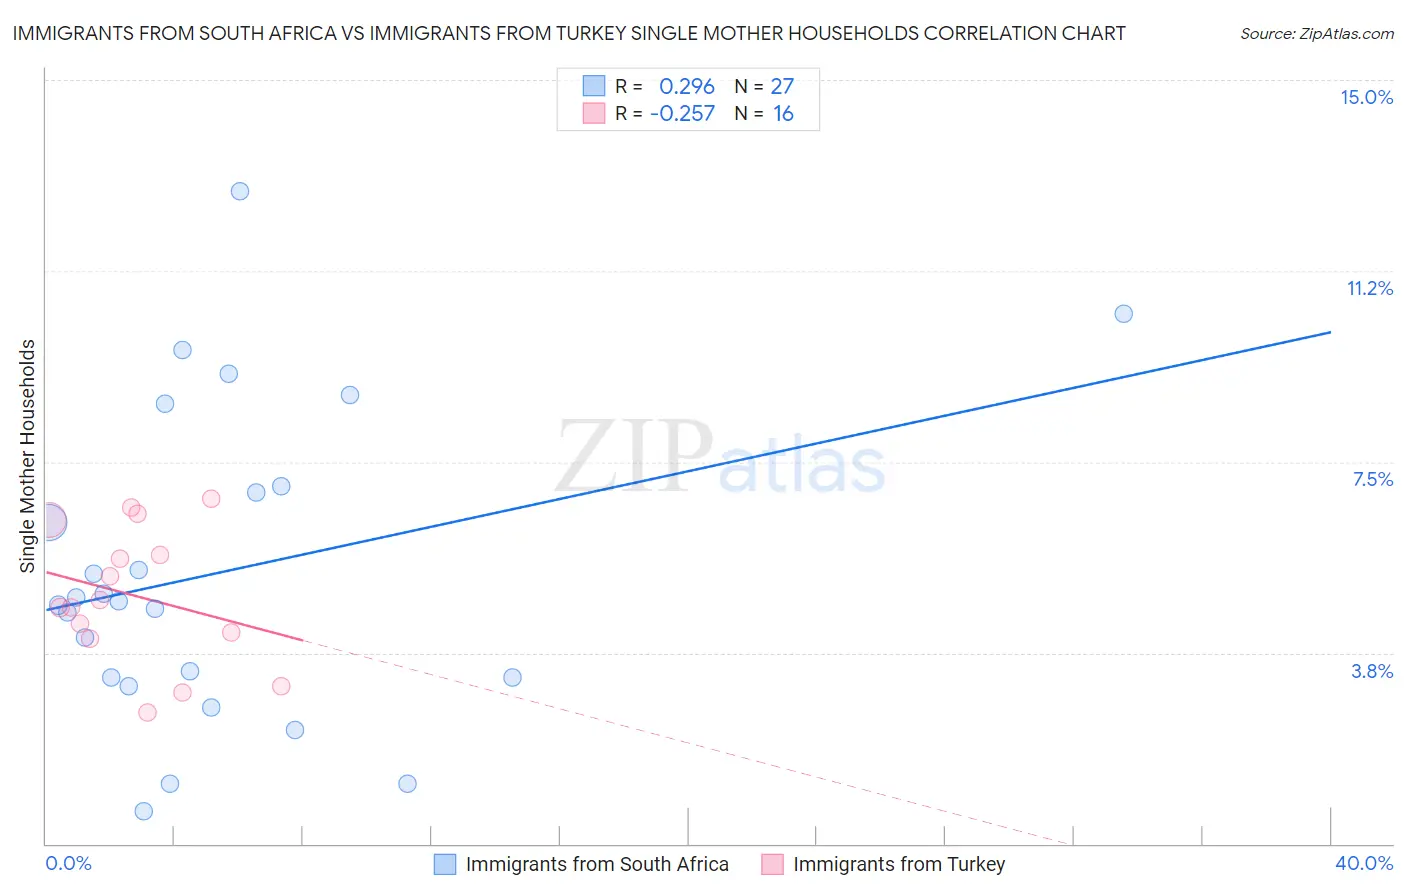
Immigrants from South Africa vs Immigrants from Turkey Single Mother Households Correlation Chart
The statistical analysis conducted on geographies consisting of 232,880,827 people shows a weak positive correlation between the proportion of Immigrants from South Africa and percentage of single mother households in the United States with a correlation coefficient (R) of 0.296 and weighted average of 5.7%. Similarly, the statistical analysis conducted on geographies consisting of 222,703,897 people shows a weak negative correlation between the proportion of Immigrants from Turkey and percentage of single mother households in the United States with a correlation coefficient (R) of -0.257 and weighted average of 5.7%, a difference of 1.2%.
Single Mother Households Correlation Summary
| Measurement | Immigrants from South Africa | Immigrants from Turkey |
| Minimum | 0.63% | 2.6% |
| Maximum | 12.8% | 6.8% |
| Range | 12.2% | 4.2% |
| Mean | 5.3% | 4.9% |
| Median | 4.8% | 4.7% |
| Interquartile 25% (IQ1) | 3.3% | 4.1% |
| Interquartile 75% (IQ3) | 7.0% | 6.0% |
| Interquartile Range (IQR) | 3.8% | 1.9% |
| Standard Deviation (Sample) | 3.0% | 1.3% |
| Standard Deviation (Population) | 3.0% | 1.3% |
Demographics Similar to Immigrants from South Africa and Immigrants from Turkey by Single Mother Households
In terms of single mother households, the demographic groups most similar to Immigrants from South Africa are Tlingit-Haida (5.7%, a difference of 0.040%), Immigrants from Poland (5.8%, a difference of 0.050%), Scandinavian (5.8%, a difference of 0.070%), Austrian (5.7%, a difference of 0.090%), and German (5.8%, a difference of 0.10%). Similarly, the demographic groups most similar to Immigrants from Turkey are Israeli (5.7%, a difference of 0.070%), Finnish (5.7%, a difference of 0.080%), Hungarian (5.7%, a difference of 0.11%), Carpatho Rusyn (5.7%, a difference of 0.26%), and Ukrainian (5.7%, a difference of 0.33%).
| Demographics | Rating | Rank | Single Mother Households |
| Immigrants | Malaysia | 97.8 /100 | #82 | Exceptional 5.7% |
| Immigrants | Hungary | 97.8 /100 | #83 | Exceptional 5.7% |
| Carpatho Rusyns | 97.7 /100 | #84 | Exceptional 5.7% |
| Hungarians | 97.6 /100 | #85 | Exceptional 5.7% |
| Finns | 97.6 /100 | #86 | Exceptional 5.7% |
| Immigrants | Turkey | 97.5 /100 | #87 | Exceptional 5.7% |
| Israelis | 97.4 /100 | #88 | Exceptional 5.7% |
| Ukrainians | 97.2 /100 | #89 | Exceptional 5.7% |
| Immigrants | Indonesia | 97.2 /100 | #90 | Exceptional 5.7% |
| Europeans | 97.0 /100 | #91 | Exceptional 5.7% |
| Immigrants | Western Asia | 96.7 /100 | #92 | Exceptional 5.7% |
| Serbians | 96.7 /100 | #93 | Exceptional 5.7% |
| Basques | 96.7 /100 | #94 | Exceptional 5.7% |
| Slovaks | 96.6 /100 | #95 | Exceptional 5.7% |
| Austrians | 96.4 /100 | #96 | Exceptional 5.7% |
| Tlingit-Haida | 96.4 /100 | #97 | Exceptional 5.7% |
| Immigrants | South Africa | 96.3 /100 | #98 | Exceptional 5.7% |
| Immigrants | Poland | 96.3 /100 | #99 | Exceptional 5.8% |
| Scandinavians | 96.2 /100 | #100 | Exceptional 5.8% |
| Germans | 96.2 /100 | #101 | Exceptional 5.8% |
| English | 96.2 /100 | #102 | Exceptional 5.8% |