Laotian vs Menominee Family Households with Children

COMPARE

Laotian
Race
Ancestry
AfghanAfricanAlaska NativeAlaskan AthabascanAlbanianAleutAlsatianAmericanApacheArabArapahoArgentineanArmenianAssyrian/Chaldean/SyriacAustralianAustrianBahamianBangladeshiBarbadianBasqueBelgianBelizeanBermudanBhutaneseBlackfeetBolivianBrazilianBritishBritish West IndianBulgarianBurmeseCajunCambodianCanadianCape VerdeanCarpatho RusynCelticCentral AmericanCentral American IndianCherokeeCheyenneChickasawChileanChineseChippewaChoctawColombianColvilleComancheCosta RicanCreeCreekCroatianCrowCubanCypriotCzechCzechoslovakianDanishDelawareDominicanDutchDutch West IndianEastern EuropeanEcuadorianEgyptianEnglishEstonianEthiopianEuropeanFijianFilipinoFinnishFrenchFrench American IndianFrench CanadianGermanGerman RussianGhanaianGreekGuamanian/ChamorroGuatemalanGuyaneseHaitianHmongHonduranHopiHoumaHungarianIcelanderIndian (Asian)IndonesianInupiatIranianIraqiIrishIroquoisIsraeliItalianJamaicanJapaneseJordanianKenyanKiowaKoreanLaotianLatvianLebaneseLiberianLithuanianLumbeeLuxembourgerMacedonianMalaysianMalteseMarshalleseMexicanMexican American IndianMongolianMoroccanNative HawaiianNavajoNepaleseNew ZealanderNicaraguanNigerianNorthern EuropeanNorwegianOkinawanOsageOttawaPaiutePakistaniPalestinianPanamanianParaguayanPennsylvania GermanPeruvianPimaPolishPortuguesePotawatomiPuebloPuerto RicanPuget Sound SalishRomanianRussianSalvadoranSamoanScandinavianScotch-IrishScottishSeminoleSenegaleseSerbianShoshoneSierra LeoneanSiouxSlavicSlovakSloveneSomaliSouth AfricanSouth AmericanSouth American IndianSoviet UnionSpaniardSpanishSpanish AmericanSpanish American IndianSri LankanSubsaharan AfricanSudaneseSwedishSwissSyrianTaiwaneseThaiTlingit-HaidaTohono O'OdhamTonganTrinidadian and TobagonianTsimshianTurkishU.S. Virgin IslanderUgandanUkrainianUruguayanUteVenezuelanVietnameseWelshWest IndianYakamaYaquiYugoslavianYumanYup'ikZimbabwean
Immigration
NonimmigrantsImmigrantsAfghanistanAfricaAlbaniaArgentinaArmeniaAsiaAustraliaAustriaBahamasBangladeshBarbadosBelarusBelgiumBelizeBoliviaBosnia and HerzegovinaBrazilBulgariaBurma/MyanmarCabo VerdeCambodiaCameroonCanadaCaribbeanCentral AmericaChileChinaColombiaCongoCosta RicaCroatiaCubaCzechoslovakiaDenmarkDominicaDominican RepublicEastern AfricaEastern AsiaEastern EuropeEcuadorEgyptEl SalvadorEnglandEritreaEthiopiaEuropeFijiFranceGermanyGhanaGreeceGrenadaGuatemalaGuyanaHaitiHondurasHong KongHungaryIndiaIndonesiaIranIraqIrelandIsraelItalyJamaicaJapanJordanKazakhstanKenyaKoreaKuwaitLaosLatin AmericaLatviaLebanonLiberiaLithuaniaMalaysiaMexicoMicronesiaMiddle AfricaMoldovaMoroccoNepalNetherlandsNicaraguaNigeriaNorth AmericaNorth MacedoniaNorthern AfricaNorthern EuropeNorwayOceaniaPakistanPanamaPeruPhilippinesPolandPortugalRomaniaRussiaSaudi ArabiaScotlandSenegalSerbiaSierra LeoneSingaporeSomaliaSouth AfricaSouth AmericaSouth Central AsiaSouth Eastern AsiaSouthern EuropeSpainSri LankaSt. Vincent and the GrenadinesSudanSwedenSwitzerlandSyriaTaiwanThailandTrinidad and TobagoTurkeyUgandaUkraineUruguayUzbekistanVenezuelaVietnamWest IndiesWestern AfricaWestern AsiaWestern EuropeYemenZaireZimbabweAzores
Menominee
Race
Ancestry
AfghanAfricanAlaska NativeAlaskan AthabascanAlbanianAleutAlsatianAmericanApacheArabArapahoArgentineanArmenianAssyrian/Chaldean/SyriacAustralianAustrianBahamianBangladeshiBarbadianBasqueBelgianBelizeanBermudanBhutaneseBlackfeetBolivianBrazilianBritishBritish West IndianBulgarianBurmeseCajunCambodianCanadianCape VerdeanCarpatho RusynCelticCentral AmericanCentral American IndianCherokeeCheyenneChickasawChileanChineseChippewaChoctawColombianColvilleComancheCosta RicanCreeCreekCroatianCrowCubanCypriotCzechCzechoslovakianDanishDelawareDominicanDutchDutch West IndianEastern EuropeanEcuadorianEgyptianEnglishEstonianEthiopianEuropeanFijianFilipinoFinnishFrenchFrench American IndianFrench CanadianGermanGerman RussianGhanaianGreekGuamanian/ChamorroGuatemalanGuyaneseHaitianHmongHonduranHopiHoumaHungarianIcelanderIndian (Asian)IndonesianInupiatIranianIraqiIrishIroquoisIsraeliItalianJamaicanJapaneseJordanianKenyanKiowaKoreanLatvianLebaneseLiberianLithuanianLumbeeLuxembourgerMacedonianMalaysianMalteseMarshalleseMenomineeMexicanMexican American IndianMongolianMoroccanNative HawaiianNavajoNepaleseNew ZealanderNicaraguanNigerianNorthern EuropeanNorwegianOkinawanOsageOttawaPaiutePakistaniPalestinianPanamanianParaguayanPennsylvania GermanPeruvianPimaPolishPortuguesePotawatomiPuebloPuerto RicanPuget Sound SalishRomanianRussianSalvadoranSamoanScandinavianScotch-IrishScottishSeminoleSenegaleseSerbianShoshoneSierra LeoneanSiouxSlavicSlovakSloveneSomaliSouth AfricanSouth AmericanSouth American IndianSoviet UnionSpaniardSpanishSpanish AmericanSpanish American IndianSri LankanSubsaharan AfricanSudaneseSwedishSwissSyrianTaiwaneseThaiTlingit-HaidaTohono O'OdhamTonganTrinidadian and TobagonianTsimshianTurkishU.S. Virgin IslanderUgandanUkrainianUruguayanUteVenezuelanVietnameseWelshWest IndianYakamaYaquiYugoslavianYumanYup'ikZimbabwean
Immigration
NonimmigrantsImmigrantsAfghanistanAfricaAlbaniaArgentinaArmeniaAsiaAustraliaAustriaBahamasBangladeshBarbadosBelarusBelgiumBelizeBoliviaBosnia and HerzegovinaBrazilBulgariaBurma/MyanmarCabo VerdeCambodiaCameroonCanadaCaribbeanCentral AmericaChileChinaColombiaCongoCosta RicaCroatiaCubaCzechoslovakiaDenmarkDominicaDominican RepublicEastern AfricaEastern AsiaEastern EuropeEcuadorEgyptEl SalvadorEnglandEritreaEthiopiaEuropeFijiFranceGermanyGhanaGreeceGrenadaGuatemalaGuyanaHaitiHondurasHong KongHungaryIndiaIndonesiaIranIraqIrelandIsraelItalyJamaicaJapanJordanKazakhstanKenyaKoreaKuwaitLaosLatin AmericaLatviaLebanonLiberiaLithuaniaMalaysiaMexicoMicronesiaMiddle AfricaMoldovaMoroccoNepalNetherlandsNicaraguaNigeriaNorth AmericaNorth MacedoniaNorthern AfricaNorthern EuropeNorwayOceaniaPakistanPanamaPeruPhilippinesPolandPortugalRomaniaRussiaSaudi ArabiaScotlandSenegalSerbiaSierra LeoneSingaporeSomaliaSouth AfricaSouth AmericaSouth Central AsiaSouth Eastern AsiaSouthern EuropeSpainSri LankaSt. Vincent and the GrenadinesSudanSwedenSwitzerlandSyriaTaiwanThailandTrinidad and TobagoTurkeyUgandaUkraineUruguayUzbekistanVenezuelaVietnamWest IndiesWestern AfricaWestern AsiaWestern EuropeYemenZaireZimbabweAzores
Family Households with Children
Income
Poverty
Unemployment
Labor Participation
Family Structure
Vehicle Availability
Education Level
Disability

Family Households with Children Comparison

Laotians

Menominee

Exceptional
Good
28.5%
FAMILY HOUSEHOLDS WITH CHILDREN
99.9/ 100
METRIC RATING
74th/ 347
METRIC RANK
27.6%
FAMILY HOUSEHOLDS WITH CHILDREN
78.9/ 100
METRIC RATING
149th/ 347
METRIC RANK

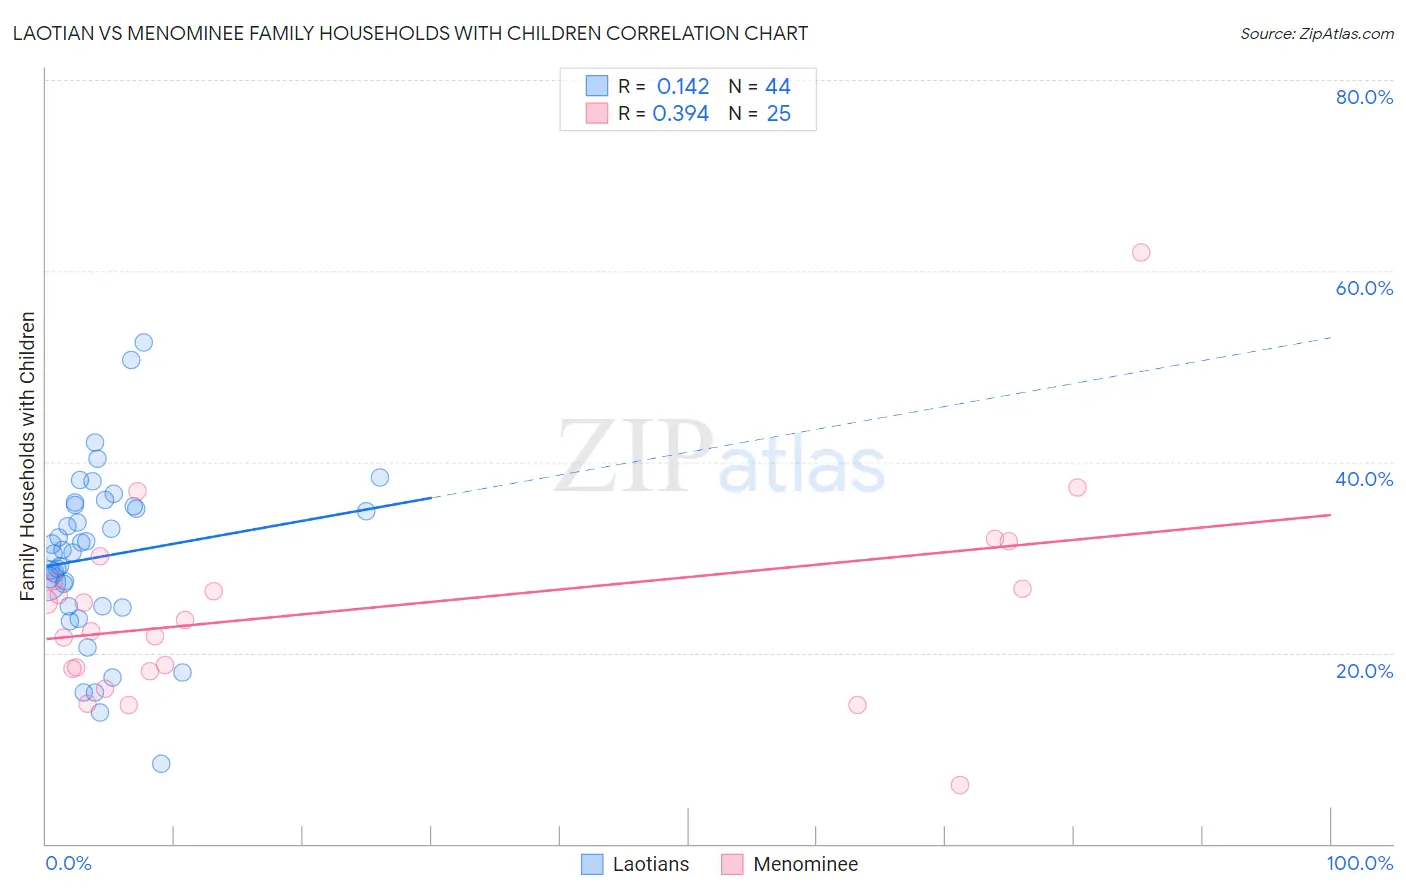
Laotian vs Menominee Family Households with Children Correlation Chart

The statistical analysis conducted on geographies consisting of 224,687,368 people shows a poor positive correlation between the proportion of Laotians and percentage of family households with children in the United States with a correlation coefficient (R) of 0.142 and weighted average of 28.5%. Similarly, the statistical analysis conducted on geographies consisting of 45,777,730 people shows a mild positive correlation between the proportion of Menominee and percentage of family households with children in the United States with a correlation coefficient (R) of 0.394 and weighted average of 27.6%, a difference of 3.0%.
Laotian vs Menominee Family Households with Children

Family Households with Children Correlation Summary

MeasurementLaotianMenominee
Minimum8.4%6.1%
Maximum52.5%61.9%
Range44.2%55.8%
Mean30.1%24.6%
Median30.6%23.4%
Interquartile 25% (IQ1)24.9%18.2%
Interquartile 75% (IQ3)35.4%28.8%
Interquartile Range (IQR)10.5%10.6%
Standard Deviation (Sample)8.9%10.7%
Standard Deviation (Population)8.8%10.5%

Similar Demographics by Family Households with Children

Demographics Similar to Laotians by Family Households with Children

In terms of family households with children, the demographic groups most similar to Laotians are Iraqi (28.5%, a difference of 0.010%), Immigrants from Indonesia (28.5%, a difference of 0.040%), Burmese (28.5%, a difference of 0.060%), Immigrants from Honduras (28.5%, a difference of 0.070%), and Immigrants from Korea (28.5%, a difference of 0.12%).
DemographicsRating | RankFamily Households with Children
Ghanaians
99.9
/100
|
#67
Exceptional
28.5%
Houma
99.9
/100
|
#68
Exceptional
28.5%
Immigrants | Korea
99.9
/100
|
#69
Exceptional
28.5%
Immigrants | Honduras
99.9
/100
|
#70
Exceptional
28.5%
Burmese
99.9
/100
|
#71
Exceptional
28.5%
Immigrants | Indonesia
99.9
/100
|
#72
Exceptional
28.5%
Iraqis
99.9
/100
|
#73
Exceptional
28.5%
Laotians
99.9
/100
|
#74
Exceptional
28.5%
Immigrants | Jordan
99.9
/100
|
#75
Exceptional
28.4%
Immigrants | Sri Lanka
99.9
/100
|
#76
Exceptional
28.4%
Nigerians
99.8
/100
|
#77
Exceptional
28.4%
Immigrants | Nepal
99.8
/100
|
#78
Exceptional
28.4%
Immigrants | Iraq
99.8
/100
|
#79
Exceptional
28.4%
Natives/Alaskans
99.8
/100
|
#80
Exceptional
28.4%
South Americans
99.8
/100
|
#81
Exceptional
28.4%

Demographics Similar to Menominee by Family Households with Children

In terms of family households with children, the demographic groups most similar to Menominee are Osage (27.6%, a difference of 0.0%), Immigrants from Moldova (27.6%, a difference of 0.010%), Argentinean (27.6%, a difference of 0.010%), Brazilian (27.7%, a difference of 0.020%), and Immigrants from Chile (27.7%, a difference of 0.020%).
DemographicsRating | RankFamily Households with Children
Swiss
81.4
/100
|
#142
Excellent
27.7%
Immigrants | Eastern Africa
80.2
/100
|
#143
Excellent
27.7%
Brazilians
79.6
/100
|
#144
Good
27.7%
Immigrants | Chile
79.5
/100
|
#145
Good
27.7%
Basques
79.5
/100
|
#146
Good
27.7%
Immigrants | Moldova
79.1
/100
|
#147
Good
27.6%
Osage
79.0
/100
|
#148
Good
27.6%
Menominee
78.9
/100
|
#149
Good
27.6%
Argentineans
78.5
/100
|
#150
Good
27.6%
Portuguese
77.8
/100
|
#151
Good
27.6%
Ethiopians
77.0
/100
|
#152
Good
27.6%
Immigrants | Cabo Verde
75.6
/100
|
#153
Good
27.6%
Icelanders
75.3
/100
|
#154
Good
27.6%
Comanche
74.8
/100
|
#155
Good
27.6%
Hungarians
74.6
/100
|
#156
Good
27.6%