Alsatian vs Italian Family Households with Children
COMPARE
Alsatian
Italian
Family Households with Children
Family Households with Children Comparison
Alsatians
Italians
25.3%
FAMILY HOUSEHOLDS WITH CHILDREN
0.0/ 100
METRIC RATING
342nd/ 347
METRIC RANK
26.8%
FAMILY HOUSEHOLDS WITH CHILDREN
1.5/ 100
METRIC RATING
253rd/ 347
METRIC RANK
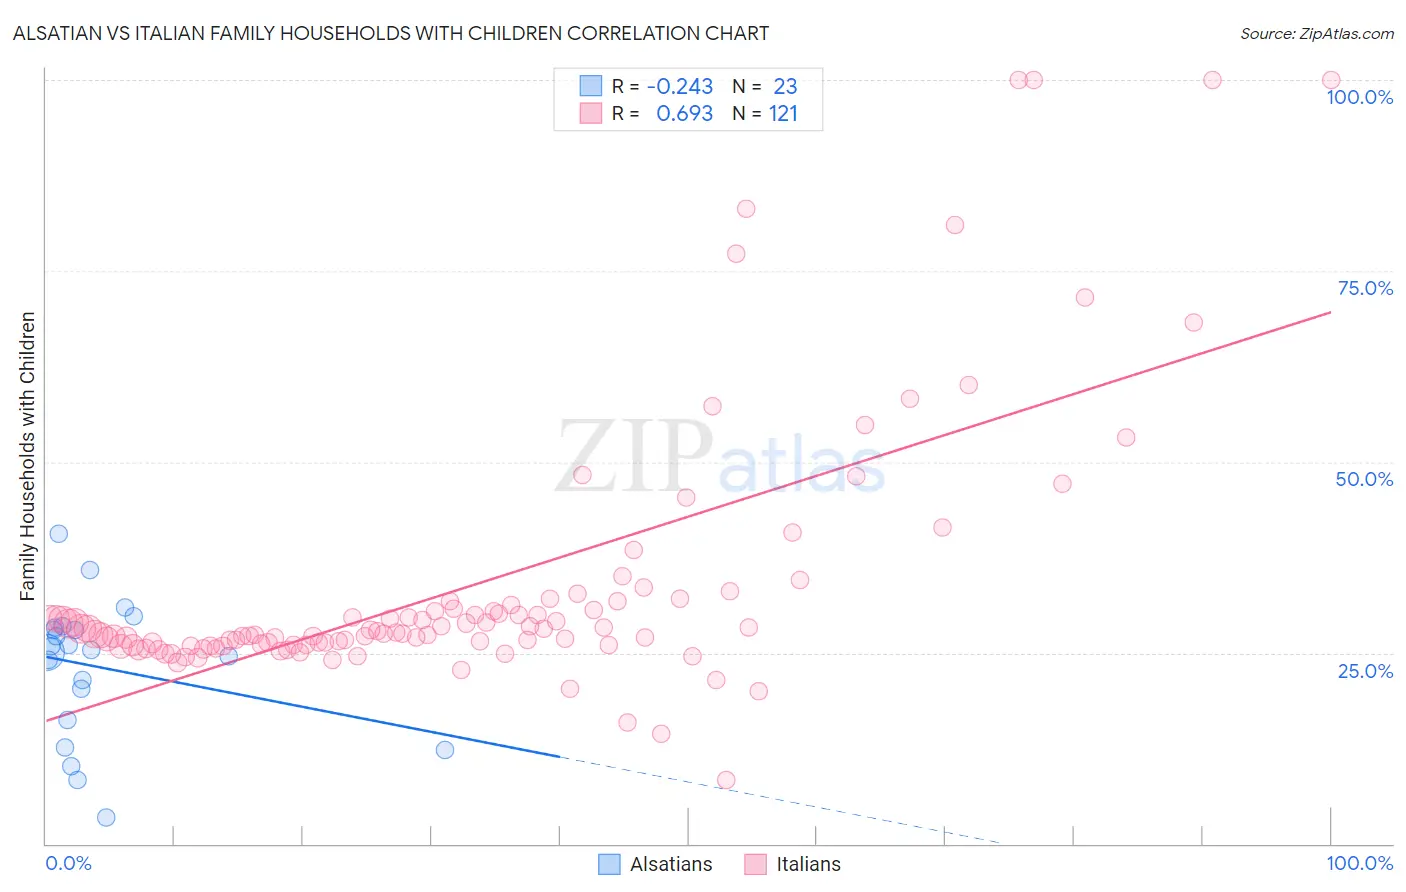
Alsatian vs Italian Family Households with Children Correlation Chart
The statistical analysis conducted on geographies consisting of 82,641,288 people shows a weak negative correlation between the proportion of Alsatians and percentage of family households with children in the United States with a correlation coefficient (R) of -0.243 and weighted average of 25.3%. Similarly, the statistical analysis conducted on geographies consisting of 573,982,396 people shows a significant positive correlation between the proportion of Italians and percentage of family households with children in the United States with a correlation coefficient (R) of 0.693 and weighted average of 26.8%, a difference of 6.1%.
Family Households with Children Correlation Summary
| Measurement | Alsatian | Italian |
| Minimum | 3.4% | 8.3% |
| Maximum | 40.5% | 100.0% |
| Range | 37.1% | 91.7% |
| Mean | 23.2% | 33.8% |
| Median | 25.4% | 27.7% |
| Interquartile 25% (IQ1) | 16.2% | 26.0% |
| Interquartile 75% (IQ3) | 28.3% | 31.4% |
| Interquartile Range (IQR) | 12.1% | 5.4% |
| Standard Deviation (Sample) | 9.0% | 17.3% |
| Standard Deviation (Population) | 8.8% | 17.3% |
Similar Demographics by Family Households with Children
Demographics Similar to Alsatians by Family Households with Children
In terms of family households with children, the demographic groups most similar to Alsatians are Hopi (25.2%, a difference of 0.16%), Pueblo (25.2%, a difference of 0.26%), Immigrants from Grenada (25.2%, a difference of 0.44%), Carpatho Rusyn (25.2%, a difference of 0.44%), and Immigrants from Serbia (25.5%, a difference of 0.68%).
| Demographics | Rating | Rank | Family Households with Children |
| Immigrants | Switzerland | 0.0 /100 | #333 | Tragic 25.7% |
| Slovaks | 0.0 /100 | #334 | Tragic 25.7% |
| Immigrants | Croatia | 0.0 /100 | #335 | Tragic 25.7% |
| Immigrants | West Indies | 0.0 /100 | #336 | Tragic 25.7% |
| Puerto Ricans | 0.0 /100 | #337 | Tragic 25.6% |
| Arapaho | 0.0 /100 | #338 | Tragic 25.6% |
| Immigrants | St. Vincent and the Grenadines | 0.0 /100 | #339 | Tragic 25.6% |
| Immigrants | Armenia | 0.0 /100 | #340 | Tragic 25.6% |
| Immigrants | Serbia | 0.0 /100 | #341 | Tragic 25.5% |
| Alsatians | 0.0 /100 | #342 | Tragic 25.3% |
| Hopi | 0.0 /100 | #343 | Tragic 25.2% |
| Pueblo | 0.0 /100 | #344 | Tragic 25.2% |
| Immigrants | Grenada | 0.0 /100 | #345 | Tragic 25.2% |
| Carpatho Rusyns | 0.0 /100 | #346 | Tragic 25.2% |
| Soviet Union | 0.0 /100 | #347 | Tragic 24.8% |
Demographics Similar to Italians by Family Households with Children
In terms of family households with children, the demographic groups most similar to Italians are Immigrants from Scotland (26.8%, a difference of 0.030%), German Russian (26.8%, a difference of 0.030%), Scotch-Irish (26.8%, a difference of 0.050%), Irish (26.8%, a difference of 0.080%), and Slavic (26.8%, a difference of 0.090%).
| Demographics | Rating | Rank | Family Households with Children |
| Jamaicans | 2.5 /100 | #246 | Tragic 26.9% |
| Potawatomi | 2.2 /100 | #247 | Tragic 26.9% |
| Immigrants | Kazakhstan | 2.2 /100 | #248 | Tragic 26.9% |
| Immigrants | Eastern Europe | 2.1 /100 | #249 | Tragic 26.9% |
| Belgians | 2.1 /100 | #250 | Tragic 26.9% |
| Immigrants | Bosnia and Herzegovina | 1.9 /100 | #251 | Tragic 26.8% |
| Irish | 1.8 /100 | #252 | Tragic 26.8% |
| Italians | 1.5 /100 | #253 | Tragic 26.8% |
| Immigrants | Scotland | 1.5 /100 | #254 | Tragic 26.8% |
| German Russians | 1.5 /100 | #255 | Tragic 26.8% |
| Scotch-Irish | 1.4 /100 | #256 | Tragic 26.8% |
| Slavs | 1.3 /100 | #257 | Tragic 26.8% |
| Immigrants | Cuba | 1.3 /100 | #258 | Tragic 26.8% |
| Immigrants | Lithuania | 1.2 /100 | #259 | Tragic 26.8% |
| Immigrants | Jamaica | 1.2 /100 | #260 | Tragic 26.8% |