Laotian vs Immigrants from Haiti Family Households with Children
COMPARE
Laotian
Immigrants from Haiti
Family Households with Children
Family Households with Children Comparison
Laotians
Immigrants from Haiti
28.5%
FAMILY HOUSEHOLDS WITH CHILDREN
99.9/ 100
METRIC RATING
74th/ 347
METRIC RANK
27.2%
FAMILY HOUSEHOLDS WITH CHILDREN
20.3/ 100
METRIC RATING
205th/ 347
METRIC RANK
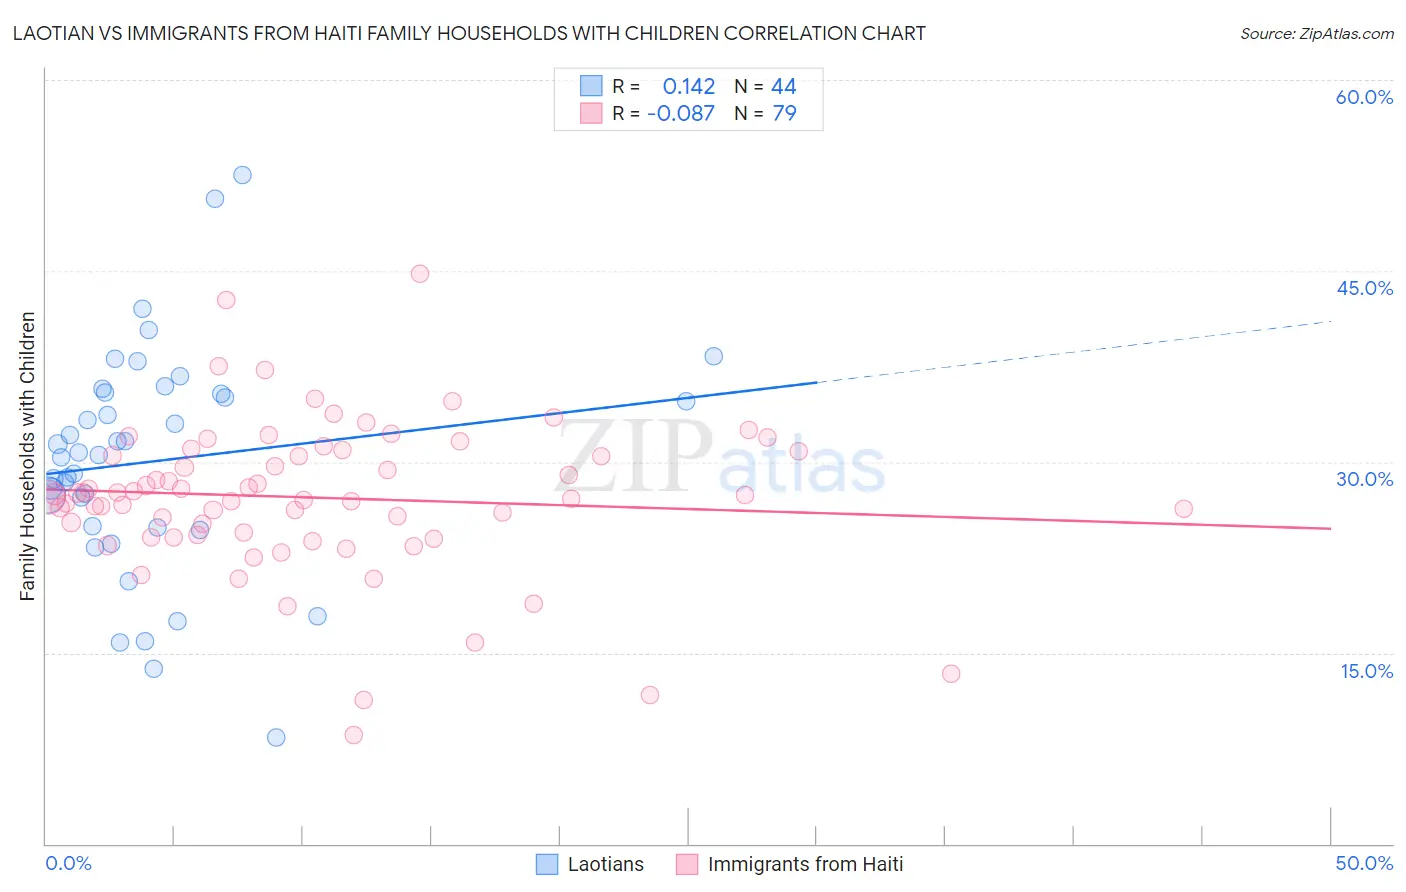
Laotian vs Immigrants from Haiti Family Households with Children Correlation Chart
The statistical analysis conducted on geographies consisting of 224,687,368 people shows a poor positive correlation between the proportion of Laotians and percentage of family households with children in the United States with a correlation coefficient (R) of 0.142 and weighted average of 28.5%. Similarly, the statistical analysis conducted on geographies consisting of 225,126,252 people shows a slight negative correlation between the proportion of Immigrants from Haiti and percentage of family households with children in the United States with a correlation coefficient (R) of -0.087 and weighted average of 27.2%, a difference of 4.5%.
Family Households with Children Correlation Summary
| Measurement | Laotian | Immigrants from Haiti |
| Minimum | 8.4% | 8.6% |
| Maximum | 52.5% | 44.8% |
| Range | 44.2% | 36.2% |
| Mean | 30.1% | 27.2% |
| Median | 30.6% | 27.4% |
| Interquartile 25% (IQ1) | 24.9% | 24.3% |
| Interquartile 75% (IQ3) | 35.4% | 30.9% |
| Interquartile Range (IQR) | 10.5% | 6.6% |
| Standard Deviation (Sample) | 8.9% | 6.1% |
| Standard Deviation (Population) | 8.8% | 6.0% |
Similar Demographics by Family Households with Children
Demographics Similar to Laotians by Family Households with Children
In terms of family households with children, the demographic groups most similar to Laotians are Iraqi (28.5%, a difference of 0.010%), Immigrants from Indonesia (28.5%, a difference of 0.040%), Burmese (28.5%, a difference of 0.060%), Immigrants from Honduras (28.5%, a difference of 0.070%), and Immigrants from Korea (28.5%, a difference of 0.12%).
| Demographics | Rating | Rank | Family Households with Children |
| Ghanaians | 99.9 /100 | #67 | Exceptional 28.5% |
| Houma | 99.9 /100 | #68 | Exceptional 28.5% |
| Immigrants | Korea | 99.9 /100 | #69 | Exceptional 28.5% |
| Immigrants | Honduras | 99.9 /100 | #70 | Exceptional 28.5% |
| Burmese | 99.9 /100 | #71 | Exceptional 28.5% |
| Immigrants | Indonesia | 99.9 /100 | #72 | Exceptional 28.5% |
| Iraqis | 99.9 /100 | #73 | Exceptional 28.5% |
| Laotians | 99.9 /100 | #74 | Exceptional 28.5% |
| Immigrants | Jordan | 99.9 /100 | #75 | Exceptional 28.4% |
| Immigrants | Sri Lanka | 99.9 /100 | #76 | Exceptional 28.4% |
| Nigerians | 99.8 /100 | #77 | Exceptional 28.4% |
| Immigrants | Nepal | 99.8 /100 | #78 | Exceptional 28.4% |
| Immigrants | Iraq | 99.8 /100 | #79 | Exceptional 28.4% |
| Natives/Alaskans | 99.8 /100 | #80 | Exceptional 28.4% |
| South Americans | 99.8 /100 | #81 | Exceptional 28.4% |
Demographics Similar to Immigrants from Haiti by Family Households with Children
In terms of family households with children, the demographic groups most similar to Immigrants from Haiti are Immigrants from Micronesia (27.2%, a difference of 0.0%), Haitian (27.2%, a difference of 0.020%), Immigrants from Sudan (27.3%, a difference of 0.050%), Kiowa (27.3%, a difference of 0.070%), and American (27.3%, a difference of 0.080%).
| Demographics | Rating | Rank | Family Households with Children |
| Immigrants | Romania | 34.4 /100 | #198 | Fair 27.4% |
| English | 32.0 /100 | #199 | Fair 27.3% |
| Immigrants | Congo | 28.7 /100 | #200 | Fair 27.3% |
| Bhutanese | 25.1 /100 | #201 | Fair 27.3% |
| Americans | 22.8 /100 | #202 | Fair 27.3% |
| Kiowa | 22.2 /100 | #203 | Fair 27.3% |
| Immigrants | Sudan | 21.6 /100 | #204 | Fair 27.3% |
| Immigrants | Haiti | 20.3 /100 | #205 | Fair 27.2% |
| Immigrants | Micronesia | 20.2 /100 | #206 | Fair 27.2% |
| Haitians | 19.8 /100 | #207 | Poor 27.2% |
| Immigrants | Poland | 16.4 /100 | #208 | Poor 27.2% |
| Dutch West Indians | 15.8 /100 | #209 | Poor 27.2% |
| Immigrants | Ukraine | 14.4 /100 | #210 | Poor 27.2% |
| Welsh | 14.2 /100 | #211 | Poor 27.2% |
| Immigrants | Dominica | 13.9 /100 | #212 | Poor 27.2% |