Korean vs American Average Family Size
COMPARE
Korean
American
Average Family Size
Average Family Size Comparison
Koreans
Americans
3.36
AVERAGE FAMILY SIZE
100.0/ 100
METRIC RATING
53rd/ 347
METRIC RANK
3.16
AVERAGE FAMILY SIZE
1.0/ 100
METRIC RATING
264th/ 347
METRIC RANK
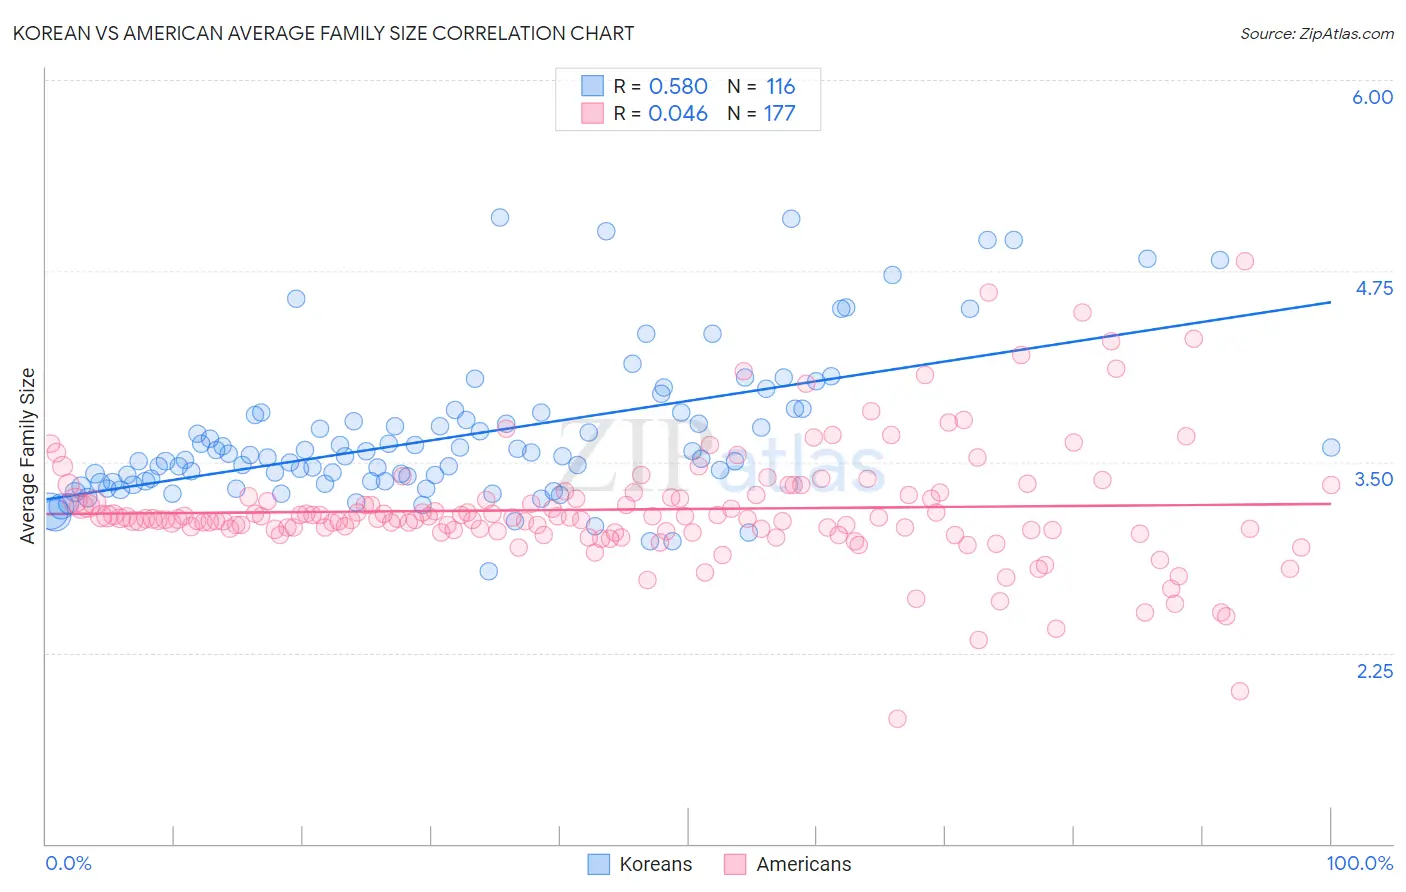
Korean vs American Average Family Size Correlation Chart
The statistical analysis conducted on geographies consisting of 510,405,149 people shows a substantial positive correlation between the proportion of Koreans and average family size in the United States with a correlation coefficient (R) of 0.580 and weighted average of 3.36. Similarly, the statistical analysis conducted on geographies consisting of 581,385,339 people shows no correlation between the proportion of Americans and average family size in the United States with a correlation coefficient (R) of 0.046 and weighted average of 3.16, a difference of 6.2%.
Average Family Size Correlation Summary
| Measurement | Korean | American |
| Minimum | 2.78 | 1.82 |
| Maximum | 5.10 | 4.81 |
| Range | 2.32 | 2.99 |
| Mean | 3.66 | 3.19 |
| Median | 3.54 | 3.13 |
| Interquartile 25% (IQ1) | 3.37 | 3.05 |
| Interquartile 75% (IQ3) | 3.81 | 3.27 |
| Interquartile Range (IQR) | 0.45 | 0.22 |
| Standard Deviation (Sample) | 0.47 | 0.39 |
| Standard Deviation (Population) | 0.47 | 0.39 |
Similar Demographics by Average Family Size
Demographics Similar to Koreans by Average Family Size
In terms of average family size, the demographic groups most similar to Koreans are Immigrants from South Eastern Asia (3.36, a difference of 0.020%), Fijian (3.36, a difference of 0.030%), Immigrants from Honduras (3.36, a difference of 0.060%), Nicaraguan (3.36, a difference of 0.090%), and Immigrants from Dominican Republic (3.35, a difference of 0.12%).
| Demographics | Rating | Rank | Average Family Size |
| Haitians | 100.0 /100 | #46 | Exceptional 3.37 |
| Vietnamese | 100.0 /100 | #47 | Exceptional 3.37 |
| Immigrants | Nicaragua | 100.0 /100 | #48 | Exceptional 3.37 |
| Bangladeshis | 100.0 /100 | #49 | Exceptional 3.37 |
| Immigrants | Bangladesh | 100.0 /100 | #50 | Exceptional 3.36 |
| Nicaraguans | 100.0 /100 | #51 | Exceptional 3.36 |
| Fijians | 100.0 /100 | #52 | Exceptional 3.36 |
| Koreans | 100.0 /100 | #53 | Exceptional 3.36 |
| Immigrants | South Eastern Asia | 100.0 /100 | #54 | Exceptional 3.36 |
| Immigrants | Honduras | 100.0 /100 | #55 | Exceptional 3.36 |
| Immigrants | Dominican Republic | 100.0 /100 | #56 | Exceptional 3.35 |
| Sri Lankans | 100.0 /100 | #57 | Exceptional 3.35 |
| Hondurans | 100.0 /100 | #58 | Exceptional 3.35 |
| Japanese | 100.0 /100 | #59 | Exceptional 3.35 |
| Immigrants | Armenia | 100.0 /100 | #60 | Exceptional 3.35 |
Demographics Similar to Americans by Average Family Size
In terms of average family size, the demographic groups most similar to Americans are Immigrants from Bulgaria (3.16, a difference of 0.020%), Immigrants from South Africa (3.16, a difference of 0.050%), Immigrants from Greece (3.16, a difference of 0.060%), Iroquois (3.16, a difference of 0.080%), and Immigrants from Russia (3.16, a difference of 0.11%).
| Demographics | Rating | Rank | Average Family Size |
| Albanians | 1.5 /100 | #257 | Tragic 3.17 |
| Turks | 1.3 /100 | #258 | Tragic 3.16 |
| Potawatomi | 1.3 /100 | #259 | Tragic 3.16 |
| Immigrants | Albania | 1.3 /100 | #260 | Tragic 3.16 |
| Immigrants | North Macedonia | 1.3 /100 | #261 | Tragic 3.16 |
| Immigrants | Russia | 1.3 /100 | #262 | Tragic 3.16 |
| Immigrants | Bulgaria | 1.0 /100 | #263 | Tragic 3.16 |
| Americans | 1.0 /100 | #264 | Tragic 3.16 |
| Immigrants | South Africa | 0.9 /100 | #265 | Tragic 3.16 |
| Immigrants | Greece | 0.9 /100 | #266 | Tragic 3.16 |
| Iroquois | 0.8 /100 | #267 | Tragic 3.16 |
| Maltese | 0.8 /100 | #268 | Tragic 3.16 |
| Immigrants | Singapore | 0.7 /100 | #269 | Tragic 3.16 |
| Tlingit-Haida | 0.7 /100 | #270 | Tragic 3.16 |
| Immigrants | Germany | 0.7 /100 | #271 | Tragic 3.15 |