Immigrants from Greece vs British West Indian Family Households
COMPARE
Immigrants from Greece
British West Indian
Family Households
Family Households Comparison
Immigrants from Greece
British West Indians
63.5%
FAMILY HOUSEHOLDS
2.9/ 100
METRIC RATING
231st/ 347
METRIC RANK
62.8%
FAMILY HOUSEHOLDS
0.1/ 100
METRIC RATING
286th/ 347
METRIC RANK
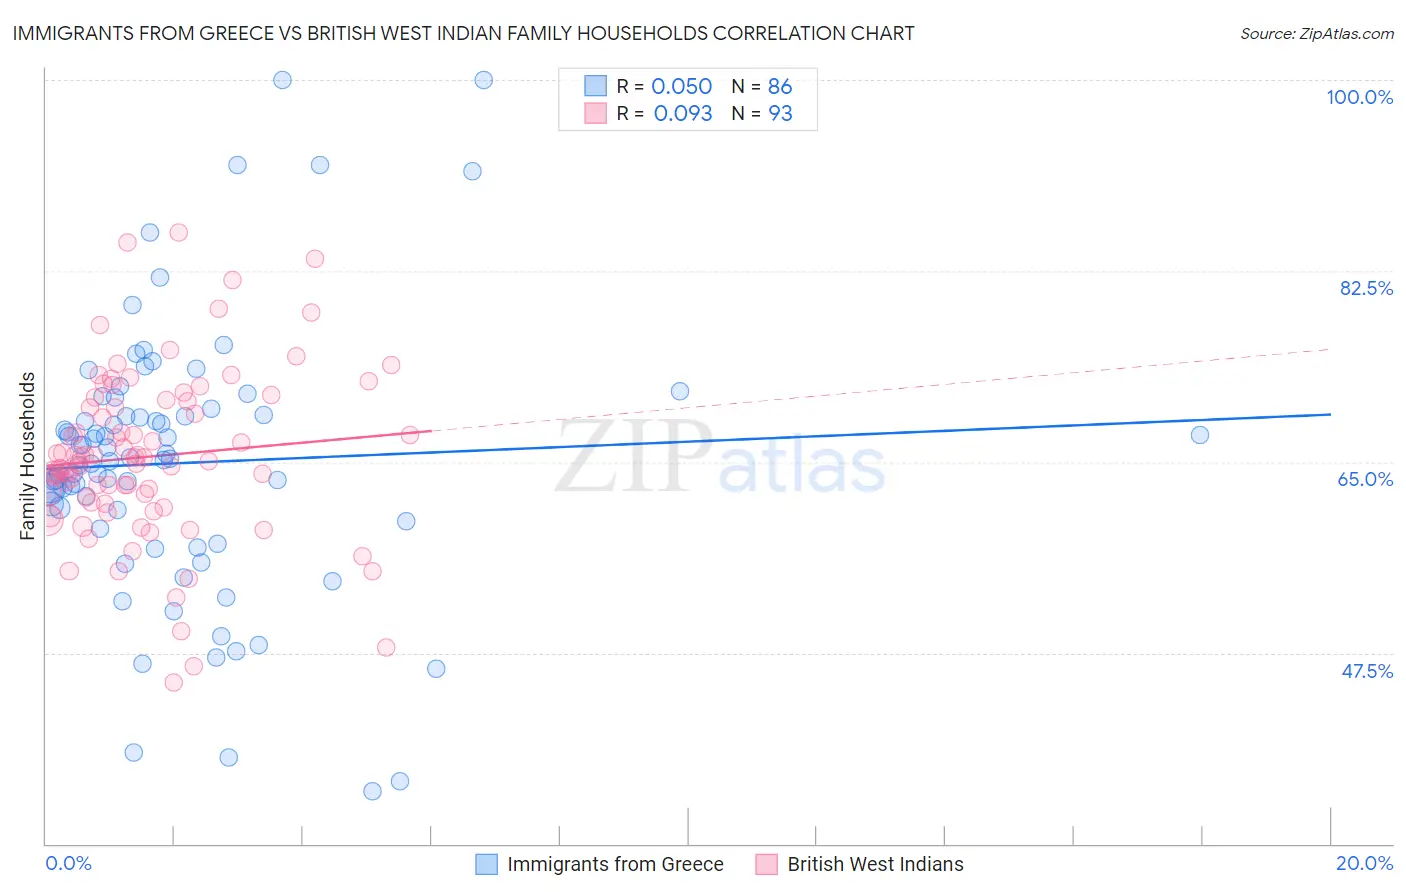
Immigrants from Greece vs British West Indian Family Households Correlation Chart
The statistical analysis conducted on geographies consisting of 216,856,850 people shows no correlation between the proportion of Immigrants from Greece and percentage of family households in the United States with a correlation coefficient (R) of 0.050 and weighted average of 63.5%. Similarly, the statistical analysis conducted on geographies consisting of 152,638,699 people shows a slight positive correlation between the proportion of British West Indians and percentage of family households in the United States with a correlation coefficient (R) of 0.093 and weighted average of 62.8%, a difference of 1.2%.
Family Households Correlation Summary
| Measurement | Immigrants from Greece | British West Indian |
| Minimum | 34.8% | 44.8% |
| Maximum | 100.0% | 86.0% |
| Range | 65.2% | 41.2% |
| Mean | 64.9% | 65.5% |
| Median | 65.2% | 65.0% |
| Interquartile 25% (IQ1) | 59.6% | 61.2% |
| Interquartile 75% (IQ3) | 69.3% | 70.6% |
| Interquartile Range (IQR) | 9.7% | 9.4% |
| Standard Deviation (Sample) | 12.3% | 7.8% |
| Standard Deviation (Population) | 12.3% | 7.7% |
Similar Demographics by Family Households
Demographics Similar to Immigrants from Greece by Family Households
In terms of family households, the demographic groups most similar to Immigrants from Greece are Immigrants from Brazil (63.6%, a difference of 0.020%), Immigrants from Northern Africa (63.5%, a difference of 0.030%), Immigrants from Armenia (63.5%, a difference of 0.050%), Bulgarian (63.6%, a difference of 0.060%), and Blackfeet (63.6%, a difference of 0.070%).
| Demographics | Rating | Rank | Family Households |
| Turks | 4.5 /100 | #224 | Tragic 63.6% |
| Immigrants | Hungary | 4.3 /100 | #225 | Tragic 63.6% |
| Immigrants | Bahamas | 4.2 /100 | #226 | Tragic 63.6% |
| Trinidadians and Tobagonians | 4.1 /100 | #227 | Tragic 63.6% |
| Blackfeet | 3.6 /100 | #228 | Tragic 63.6% |
| Bulgarians | 3.4 /100 | #229 | Tragic 63.6% |
| Immigrants | Brazil | 3.0 /100 | #230 | Tragic 63.6% |
| Immigrants | Greece | 2.9 /100 | #231 | Tragic 63.5% |
| Immigrants | Northern Africa | 2.6 /100 | #232 | Tragic 63.5% |
| Immigrants | Armenia | 2.6 /100 | #233 | Tragic 63.5% |
| Finns | 2.3 /100 | #234 | Tragic 63.5% |
| Albanians | 2.2 /100 | #235 | Tragic 63.5% |
| Ghanaians | 2.1 /100 | #236 | Tragic 63.5% |
| Comanche | 2.1 /100 | #237 | Tragic 63.5% |
| Immigrants | Zimbabwe | 2.0 /100 | #238 | Tragic 63.5% |
Demographics Similar to British West Indians by Family Households
In terms of family households, the demographic groups most similar to British West Indians are Latvian (62.8%, a difference of 0.0%), Immigrants from Uganda (62.7%, a difference of 0.020%), Mongolian (62.8%, a difference of 0.030%), Immigrants from Nepal (62.7%, a difference of 0.11%), and Australian (62.8%, a difference of 0.13%).
| Demographics | Rating | Rank | Family Households |
| Immigrants | Yemen | 0.2 /100 | #279 | Tragic 63.0% |
| Immigrants | Bulgaria | 0.2 /100 | #280 | Tragic 63.0% |
| Estonians | 0.2 /100 | #281 | Tragic 62.9% |
| New Zealanders | 0.1 /100 | #282 | Tragic 62.9% |
| Immigrants | Denmark | 0.1 /100 | #283 | Tragic 62.9% |
| Australians | 0.1 /100 | #284 | Tragic 62.8% |
| Mongolians | 0.1 /100 | #285 | Tragic 62.8% |
| British West Indians | 0.1 /100 | #286 | Tragic 62.8% |
| Latvians | 0.1 /100 | #287 | Tragic 62.8% |
| Immigrants | Uganda | 0.1 /100 | #288 | Tragic 62.7% |
| Immigrants | Nepal | 0.1 /100 | #289 | Tragic 62.7% |
| Immigrants | Grenada | 0.0 /100 | #290 | Tragic 62.6% |
| U.S. Virgin Islanders | 0.0 /100 | #291 | Tragic 62.6% |
| Immigrants | Burma/Myanmar | 0.0 /100 | #292 | Tragic 62.6% |
| Immigrants | Sweden | 0.0 /100 | #293 | Tragic 62.5% |