Kenyan vs Apache Single Mother Households
COMPARE
Kenyan
Apache
Single Mother Households
Single Mother Households Comparison
Kenyans
Apache
7.0%
SINGLE MOTHER HOUSEHOLDS
2.3/ 100
METRIC RATING
227th/ 347
METRIC RANK
7.9%
SINGLE MOTHER HOUSEHOLDS
0.0/ 100
METRIC RATING
294th/ 347
METRIC RANK
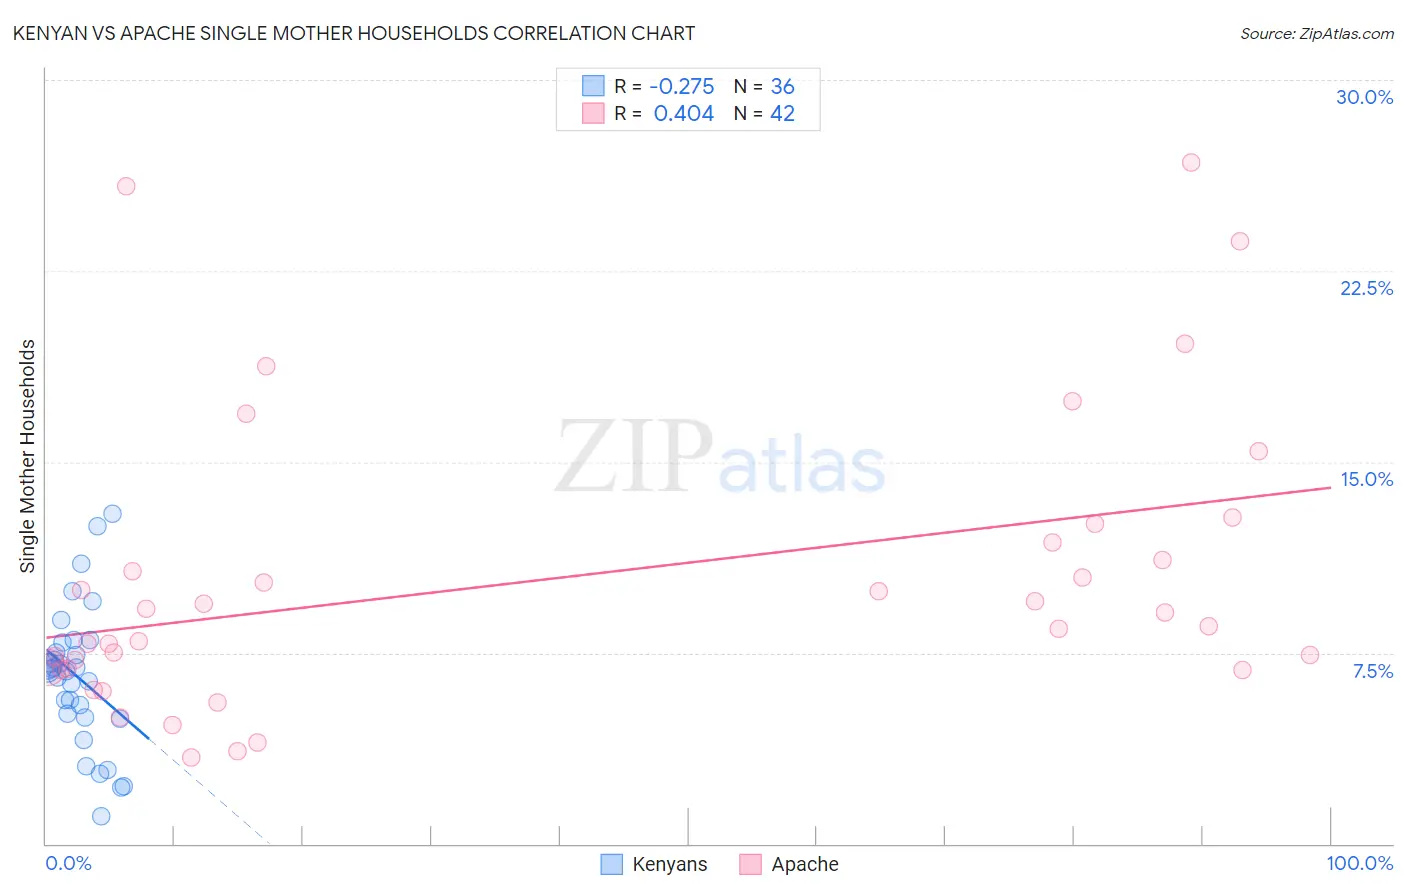
Kenyan vs Apache Single Mother Households Correlation Chart
The statistical analysis conducted on geographies consisting of 168,075,202 people shows a weak negative correlation between the proportion of Kenyans and percentage of single mother households in the United States with a correlation coefficient (R) of -0.275 and weighted average of 7.0%. Similarly, the statistical analysis conducted on geographies consisting of 230,770,959 people shows a moderate positive correlation between the proportion of Apache and percentage of single mother households in the United States with a correlation coefficient (R) of 0.404 and weighted average of 7.9%, a difference of 13.2%.
Single Mother Households Correlation Summary
| Measurement | Kenyan | Apache |
| Minimum | 1.1% | 3.4% |
| Maximum | 13.0% | 26.8% |
| Range | 11.9% | 23.4% |
| Mean | 6.5% | 10.4% |
| Median | 6.9% | 8.8% |
| Interquartile 25% (IQ1) | 5.0% | 6.9% |
| Interquartile 75% (IQ3) | 7.7% | 11.8% |
| Interquartile Range (IQR) | 2.7% | 5.0% |
| Standard Deviation (Sample) | 2.7% | 5.7% |
| Standard Deviation (Population) | 2.7% | 5.7% |
Similar Demographics by Single Mother Households
Demographics Similar to Kenyans by Single Mother Households
In terms of single mother households, the demographic groups most similar to Kenyans are Iroquois (7.0%, a difference of 0.030%), Paiute (7.0%, a difference of 0.14%), Immigrants from Kenya (7.0%, a difference of 0.20%), Sudanese (6.9%, a difference of 0.82%), and Creek (7.0%, a difference of 0.91%).
| Demographics | Rating | Rank | Single Mother Households |
| Immigrants | Thailand | 4.0 /100 | #220 | Tragic 6.9% |
| French American Indians | 3.7 /100 | #221 | Tragic 6.9% |
| Immigrants | Bangladesh | 3.7 /100 | #222 | Tragic 6.9% |
| Immigrants | Micronesia | 3.6 /100 | #223 | Tragic 6.9% |
| Immigrants | Sudan | 3.5 /100 | #224 | Tragic 6.9% |
| Sudanese | 3.1 /100 | #225 | Tragic 6.9% |
| Paiute | 2.4 /100 | #226 | Tragic 7.0% |
| Kenyans | 2.3 /100 | #227 | Tragic 7.0% |
| Iroquois | 2.2 /100 | #228 | Tragic 7.0% |
| Immigrants | Kenya | 2.1 /100 | #229 | Tragic 7.0% |
| Creek | 1.6 /100 | #230 | Tragic 7.0% |
| Spanish Americans | 1.6 /100 | #231 | Tragic 7.0% |
| Comanche | 1.5 /100 | #232 | Tragic 7.0% |
| Choctaw | 1.4 /100 | #233 | Tragic 7.0% |
| Chickasaw | 1.4 /100 | #234 | Tragic 7.0% |
Demographics Similar to Apache by Single Mother Households
In terms of single mother households, the demographic groups most similar to Apache are Immigrants from Cameroon (7.9%, a difference of 0.10%), Barbadian (7.9%, a difference of 0.29%), Immigrants from Latin America (7.9%, a difference of 0.35%), Hispanic or Latino (7.9%, a difference of 0.39%), and Ghanaian (7.8%, a difference of 0.46%).
| Demographics | Rating | Rank | Single Mother Households |
| Immigrants | Guatemala | 0.0 /100 | #287 | Tragic 7.7% |
| Sierra Leoneans | 0.0 /100 | #288 | Tragic 7.7% |
| Sub-Saharan Africans | 0.0 /100 | #289 | Tragic 7.8% |
| Immigrants | Nigeria | 0.0 /100 | #290 | Tragic 7.8% |
| West Indians | 0.0 /100 | #291 | Tragic 7.8% |
| Ghanaians | 0.0 /100 | #292 | Tragic 7.8% |
| Immigrants | Cameroon | 0.0 /100 | #293 | Tragic 7.9% |
| Apache | 0.0 /100 | #294 | Tragic 7.9% |
| Barbadians | 0.0 /100 | #295 | Tragic 7.9% |
| Immigrants | Latin America | 0.0 /100 | #296 | Tragic 7.9% |
| Hispanics or Latinos | 0.0 /100 | #297 | Tragic 7.9% |
| Immigrants | West Indies | 0.0 /100 | #298 | Tragic 7.9% |
| Houma | 0.0 /100 | #299 | Tragic 7.9% |
| Mexicans | 0.0 /100 | #300 | Tragic 8.0% |
| Chippewa | 0.0 /100 | #301 | Tragic 8.0% |