Kenyan vs Cajun Single Mother Households
COMPARE
Kenyan
Cajun
Single Mother Households
Single Mother Households Comparison
Kenyans
Cajuns
7.0%
SINGLE MOTHER HOUSEHOLDS
2.3/ 100
METRIC RATING
227th/ 347
METRIC RANK
7.3%
SINGLE MOTHER HOUSEHOLDS
0.3/ 100
METRIC RATING
253rd/ 347
METRIC RANK
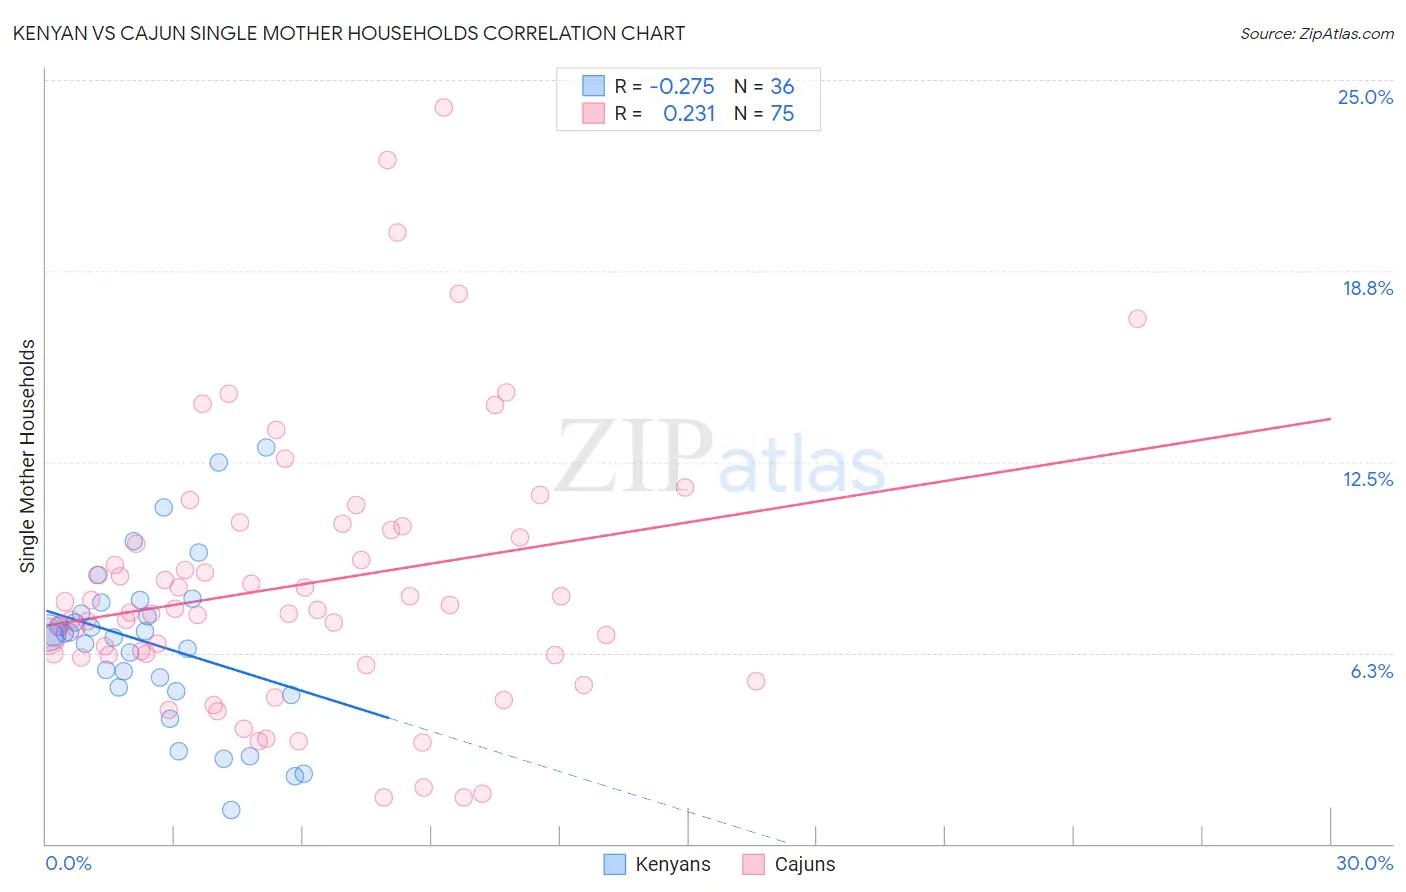
Kenyan vs Cajun Single Mother Households Correlation Chart
The statistical analysis conducted on geographies consisting of 168,075,202 people shows a weak negative correlation between the proportion of Kenyans and percentage of single mother households in the United States with a correlation coefficient (R) of -0.275 and weighted average of 7.0%. Similarly, the statistical analysis conducted on geographies consisting of 149,572,157 people shows a weak positive correlation between the proportion of Cajuns and percentage of single mother households in the United States with a correlation coefficient (R) of 0.231 and weighted average of 7.3%, a difference of 5.4%.
Single Mother Households Correlation Summary
| Measurement | Kenyan | Cajun |
| Minimum | 1.1% | 1.5% |
| Maximum | 13.0% | 24.1% |
| Range | 11.9% | 22.6% |
| Mean | 6.5% | 8.5% |
| Median | 6.9% | 7.6% |
| Interquartile 25% (IQ1) | 5.0% | 6.2% |
| Interquartile 75% (IQ3) | 7.7% | 10.3% |
| Interquartile Range (IQR) | 2.7% | 4.1% |
| Standard Deviation (Sample) | 2.7% | 4.4% |
| Standard Deviation (Population) | 2.7% | 4.4% |
Similar Demographics by Single Mother Households
Demographics Similar to Kenyans by Single Mother Households
In terms of single mother households, the demographic groups most similar to Kenyans are Iroquois (7.0%, a difference of 0.030%), Paiute (7.0%, a difference of 0.14%), Immigrants from Kenya (7.0%, a difference of 0.20%), Sudanese (6.9%, a difference of 0.82%), and Creek (7.0%, a difference of 0.91%).
| Demographics | Rating | Rank | Single Mother Households |
| Immigrants | Thailand | 4.0 /100 | #220 | Tragic 6.9% |
| French American Indians | 3.7 /100 | #221 | Tragic 6.9% |
| Immigrants | Bangladesh | 3.7 /100 | #222 | Tragic 6.9% |
| Immigrants | Micronesia | 3.6 /100 | #223 | Tragic 6.9% |
| Immigrants | Sudan | 3.5 /100 | #224 | Tragic 6.9% |
| Sudanese | 3.1 /100 | #225 | Tragic 6.9% |
| Paiute | 2.4 /100 | #226 | Tragic 7.0% |
| Kenyans | 2.3 /100 | #227 | Tragic 7.0% |
| Iroquois | 2.2 /100 | #228 | Tragic 7.0% |
| Immigrants | Kenya | 2.1 /100 | #229 | Tragic 7.0% |
| Creek | 1.6 /100 | #230 | Tragic 7.0% |
| Spanish Americans | 1.6 /100 | #231 | Tragic 7.0% |
| Comanche | 1.5 /100 | #232 | Tragic 7.0% |
| Choctaw | 1.4 /100 | #233 | Tragic 7.0% |
| Chickasaw | 1.4 /100 | #234 | Tragic 7.0% |
Demographics Similar to Cajuns by Single Mother Households
In terms of single mother households, the demographic groups most similar to Cajuns are Immigrants from Ecuador (7.3%, a difference of 0.050%), Alaskan Athabascan (7.3%, a difference of 0.38%), Malaysian (7.3%, a difference of 0.41%), Mexican American Indian (7.4%, a difference of 0.42%), and Immigrants from Africa (7.3%, a difference of 0.75%).
| Demographics | Rating | Rank | Single Mother Households |
| Nicaraguans | 0.5 /100 | #246 | Tragic 7.2% |
| Dutch West Indians | 0.4 /100 | #247 | Tragic 7.3% |
| Spanish American Indians | 0.4 /100 | #248 | Tragic 7.3% |
| Bermudans | 0.4 /100 | #249 | Tragic 7.3% |
| Immigrants | Africa | 0.4 /100 | #250 | Tragic 7.3% |
| Malaysians | 0.3 /100 | #251 | Tragic 7.3% |
| Alaskan Athabascans | 0.3 /100 | #252 | Tragic 7.3% |
| Cajuns | 0.3 /100 | #253 | Tragic 7.3% |
| Immigrants | Ecuador | 0.3 /100 | #254 | Tragic 7.3% |
| Mexican American Indians | 0.2 /100 | #255 | Tragic 7.4% |
| Seminole | 0.2 /100 | #256 | Tragic 7.4% |
| Alaska Natives | 0.2 /100 | #257 | Tragic 7.4% |
| Pueblo | 0.2 /100 | #258 | Tragic 7.4% |
| Immigrants | Yemen | 0.2 /100 | #259 | Tragic 7.4% |
| Immigrants | Zaire | 0.2 /100 | #260 | Tragic 7.4% |