Dutch vs Apache Single Mother Households
COMPARE
Dutch
Apache
Single Mother Households
Single Mother Households Comparison
Dutch
Apache
5.8%
SINGLE MOTHER HOUSEHOLDS
95.1/ 100
METRIC RATING
114th/ 347
METRIC RANK
7.9%
SINGLE MOTHER HOUSEHOLDS
0.0/ 100
METRIC RATING
294th/ 347
METRIC RANK
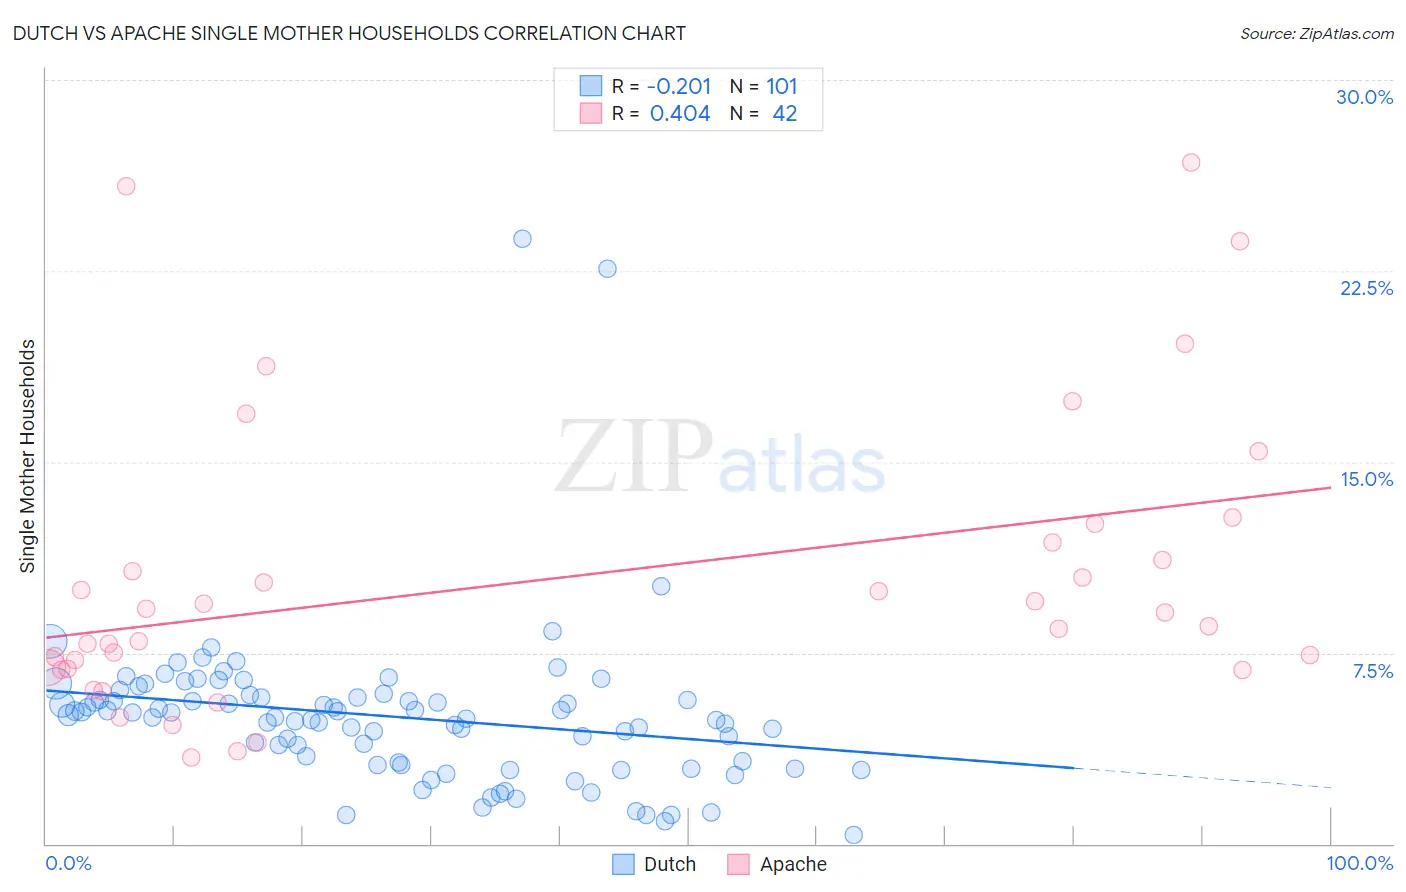
Dutch vs Apache Single Mother Households Correlation Chart
The statistical analysis conducted on geographies consisting of 549,817,585 people shows a weak negative correlation between the proportion of Dutch and percentage of single mother households in the United States with a correlation coefficient (R) of -0.201 and weighted average of 5.8%. Similarly, the statistical analysis conducted on geographies consisting of 230,770,959 people shows a moderate positive correlation between the proportion of Apache and percentage of single mother households in the United States with a correlation coefficient (R) of 0.404 and weighted average of 7.9%, a difference of 35.9%.
Single Mother Households Correlation Summary
| Measurement | Dutch | Apache |
| Minimum | 0.36% | 3.4% |
| Maximum | 23.8% | 26.8% |
| Range | 23.4% | 23.4% |
| Mean | 5.0% | 10.4% |
| Median | 5.0% | 8.8% |
| Interquartile 25% (IQ1) | 3.1% | 6.9% |
| Interquartile 75% (IQ3) | 5.8% | 11.8% |
| Interquartile Range (IQR) | 2.7% | 5.0% |
| Standard Deviation (Sample) | 3.2% | 5.7% |
| Standard Deviation (Population) | 3.2% | 5.7% |
Similar Demographics by Single Mother Households
Demographics Similar to Dutch by Single Mother Households
In terms of single mother households, the demographic groups most similar to Dutch are Mongolian (5.8%, a difference of 0.13%), Irish (5.8%, a difference of 0.19%), Immigrants from Kuwait (5.8%, a difference of 0.20%), Immigrants from England (5.8%, a difference of 0.24%), and Pennsylvania German (5.8%, a difference of 0.25%).
| Demographics | Rating | Rank | Single Mother Households |
| Paraguayans | 95.8 /100 | #107 | Exceptional 5.8% |
| Immigrants | Italy | 95.8 /100 | #108 | Exceptional 5.8% |
| Immigrants | Western Europe | 95.7 /100 | #109 | Exceptional 5.8% |
| British | 95.5 /100 | #110 | Exceptional 5.8% |
| Immigrants | England | 95.5 /100 | #111 | Exceptional 5.8% |
| Immigrants | Kuwait | 95.4 /100 | #112 | Exceptional 5.8% |
| Mongolians | 95.3 /100 | #113 | Exceptional 5.8% |
| Dutch | 95.1 /100 | #114 | Exceptional 5.8% |
| Irish | 94.8 /100 | #115 | Exceptional 5.8% |
| Pennsylvania Germans | 94.7 /100 | #116 | Exceptional 5.8% |
| Bolivians | 94.6 /100 | #117 | Exceptional 5.8% |
| Laotians | 94.3 /100 | #118 | Exceptional 5.8% |
| South Africans | 94.1 /100 | #119 | Exceptional 5.8% |
| Tongans | 93.7 /100 | #120 | Exceptional 5.8% |
| Argentineans | 93.7 /100 | #121 | Exceptional 5.8% |
Demographics Similar to Apache by Single Mother Households
In terms of single mother households, the demographic groups most similar to Apache are Immigrants from Cameroon (7.9%, a difference of 0.10%), Barbadian (7.9%, a difference of 0.29%), Immigrants from Latin America (7.9%, a difference of 0.35%), Hispanic or Latino (7.9%, a difference of 0.39%), and Ghanaian (7.8%, a difference of 0.46%).
| Demographics | Rating | Rank | Single Mother Households |
| Immigrants | Guatemala | 0.0 /100 | #287 | Tragic 7.7% |
| Sierra Leoneans | 0.0 /100 | #288 | Tragic 7.7% |
| Sub-Saharan Africans | 0.0 /100 | #289 | Tragic 7.8% |
| Immigrants | Nigeria | 0.0 /100 | #290 | Tragic 7.8% |
| West Indians | 0.0 /100 | #291 | Tragic 7.8% |
| Ghanaians | 0.0 /100 | #292 | Tragic 7.8% |
| Immigrants | Cameroon | 0.0 /100 | #293 | Tragic 7.9% |
| Apache | 0.0 /100 | #294 | Tragic 7.9% |
| Barbadians | 0.0 /100 | #295 | Tragic 7.9% |
| Immigrants | Latin America | 0.0 /100 | #296 | Tragic 7.9% |
| Hispanics or Latinos | 0.0 /100 | #297 | Tragic 7.9% |
| Immigrants | West Indies | 0.0 /100 | #298 | Tragic 7.9% |
| Houma | 0.0 /100 | #299 | Tragic 7.9% |
| Mexicans | 0.0 /100 | #300 | Tragic 8.0% |
| Chippewa | 0.0 /100 | #301 | Tragic 8.0% |