Kenyan vs Laotian Single Mother Households
COMPARE
Kenyan
Laotian
Single Mother Households
Single Mother Households Comparison
Kenyans
Laotians
7.0%
SINGLE MOTHER HOUSEHOLDS
2.3/ 100
METRIC RATING
227th/ 347
METRIC RANK
5.8%
SINGLE MOTHER HOUSEHOLDS
94.3/ 100
METRIC RATING
118th/ 347
METRIC RANK
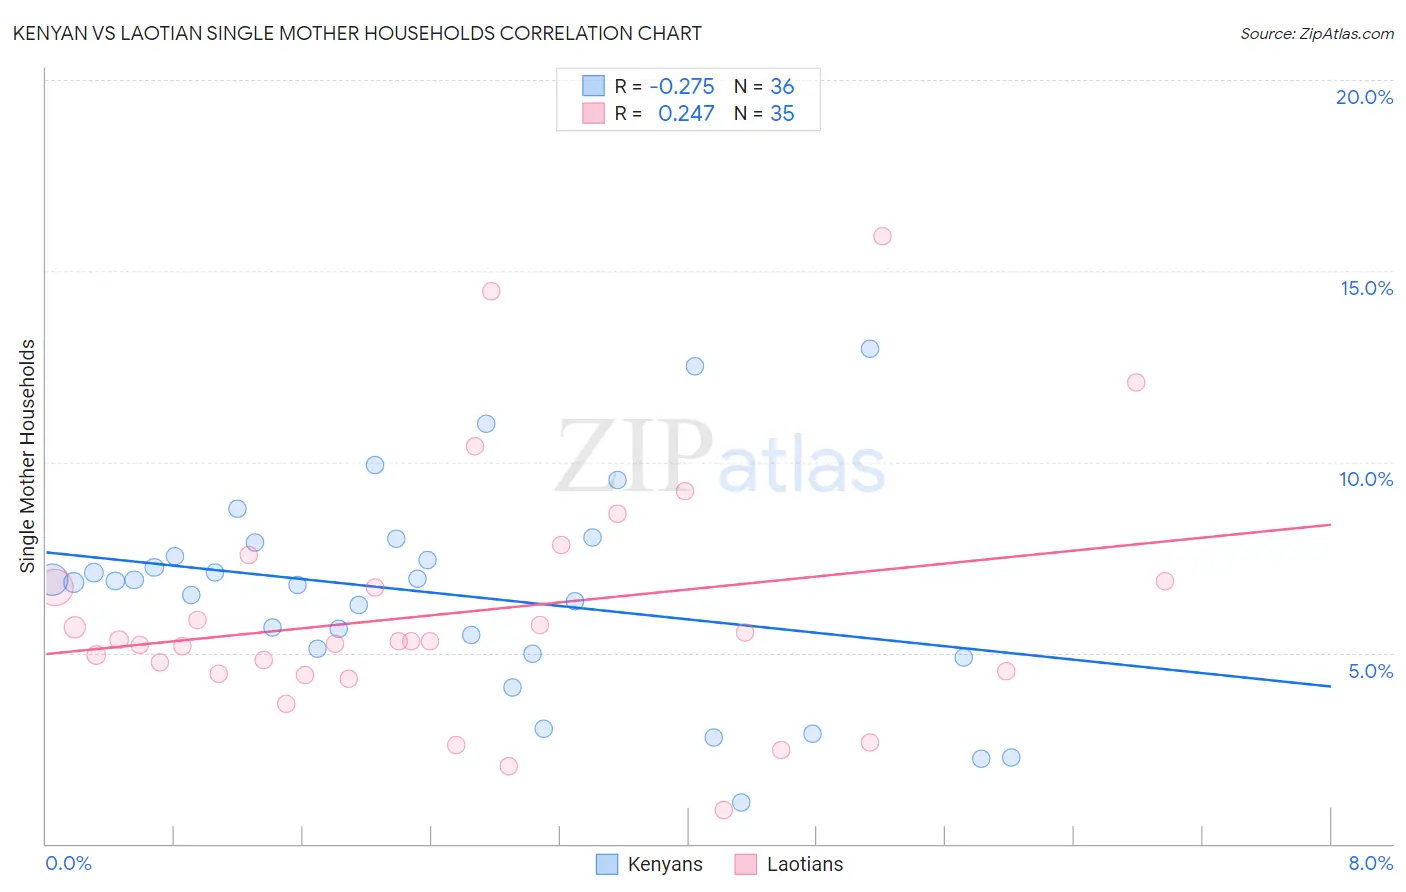
Kenyan vs Laotian Single Mother Households Correlation Chart
The statistical analysis conducted on geographies consisting of 168,075,202 people shows a weak negative correlation between the proportion of Kenyans and percentage of single mother households in the United States with a correlation coefficient (R) of -0.275 and weighted average of 7.0%. Similarly, the statistical analysis conducted on geographies consisting of 224,525,105 people shows a weak positive correlation between the proportion of Laotians and percentage of single mother households in the United States with a correlation coefficient (R) of 0.247 and weighted average of 5.8%, a difference of 19.5%.
Single Mother Households Correlation Summary
| Measurement | Kenyan | Laotian |
| Minimum | 1.1% | 0.87% |
| Maximum | 13.0% | 15.9% |
| Range | 11.9% | 15.0% |
| Mean | 6.5% | 6.1% |
| Median | 6.9% | 5.3% |
| Interquartile 25% (IQ1) | 5.0% | 4.5% |
| Interquartile 75% (IQ3) | 7.7% | 6.9% |
| Interquartile Range (IQR) | 2.7% | 2.4% |
| Standard Deviation (Sample) | 2.7% | 3.2% |
| Standard Deviation (Population) | 2.7% | 3.2% |
Similar Demographics by Single Mother Households
Demographics Similar to Kenyans by Single Mother Households
In terms of single mother households, the demographic groups most similar to Kenyans are Iroquois (7.0%, a difference of 0.030%), Paiute (7.0%, a difference of 0.14%), Immigrants from Kenya (7.0%, a difference of 0.20%), Sudanese (6.9%, a difference of 0.82%), and Creek (7.0%, a difference of 0.91%).
| Demographics | Rating | Rank | Single Mother Households |
| Immigrants | Thailand | 4.0 /100 | #220 | Tragic 6.9% |
| French American Indians | 3.7 /100 | #221 | Tragic 6.9% |
| Immigrants | Bangladesh | 3.7 /100 | #222 | Tragic 6.9% |
| Immigrants | Micronesia | 3.6 /100 | #223 | Tragic 6.9% |
| Immigrants | Sudan | 3.5 /100 | #224 | Tragic 6.9% |
| Sudanese | 3.1 /100 | #225 | Tragic 6.9% |
| Paiute | 2.4 /100 | #226 | Tragic 7.0% |
| Kenyans | 2.3 /100 | #227 | Tragic 7.0% |
| Iroquois | 2.2 /100 | #228 | Tragic 7.0% |
| Immigrants | Kenya | 2.1 /100 | #229 | Tragic 7.0% |
| Creek | 1.6 /100 | #230 | Tragic 7.0% |
| Spanish Americans | 1.6 /100 | #231 | Tragic 7.0% |
| Comanche | 1.5 /100 | #232 | Tragic 7.0% |
| Choctaw | 1.4 /100 | #233 | Tragic 7.0% |
| Chickasaw | 1.4 /100 | #234 | Tragic 7.0% |
Demographics Similar to Laotians by Single Mother Households
In terms of single mother households, the demographic groups most similar to Laotians are South African (5.8%, a difference of 0.11%), Bolivian (5.8%, a difference of 0.18%), Pennsylvania German (5.8%, a difference of 0.25%), Tongan (5.8%, a difference of 0.30%), and Irish (5.8%, a difference of 0.32%).
| Demographics | Rating | Rank | Single Mother Households |
| Immigrants | England | 95.5 /100 | #111 | Exceptional 5.8% |
| Immigrants | Kuwait | 95.4 /100 | #112 | Exceptional 5.8% |
| Mongolians | 95.3 /100 | #113 | Exceptional 5.8% |
| Dutch | 95.1 /100 | #114 | Exceptional 5.8% |
| Irish | 94.8 /100 | #115 | Exceptional 5.8% |
| Pennsylvania Germans | 94.7 /100 | #116 | Exceptional 5.8% |
| Bolivians | 94.6 /100 | #117 | Exceptional 5.8% |
| Laotians | 94.3 /100 | #118 | Exceptional 5.8% |
| South Africans | 94.1 /100 | #119 | Exceptional 5.8% |
| Tongans | 93.7 /100 | #120 | Exceptional 5.8% |
| Argentineans | 93.7 /100 | #121 | Exceptional 5.8% |
| Belgians | 93.5 /100 | #122 | Exceptional 5.8% |
| Immigrants | Uzbekistan | 93.4 /100 | #123 | Exceptional 5.9% |
| Immigrants | Argentina | 93.2 /100 | #124 | Exceptional 5.9% |
| Slavs | 92.9 /100 | #125 | Exceptional 5.9% |