Jordanian vs Norwegian Family Households with Children
COMPARE
Jordanian
Norwegian
Family Households with Children
Family Households with Children Comparison
Jordanians
Norwegians
29.0%
FAMILY HOUSEHOLDS WITH CHILDREN
100.0/ 100
METRIC RATING
49th/ 347
METRIC RANK
27.4%
FAMILY HOUSEHOLDS WITH CHILDREN
35.0/ 100
METRIC RATING
197th/ 347
METRIC RANK
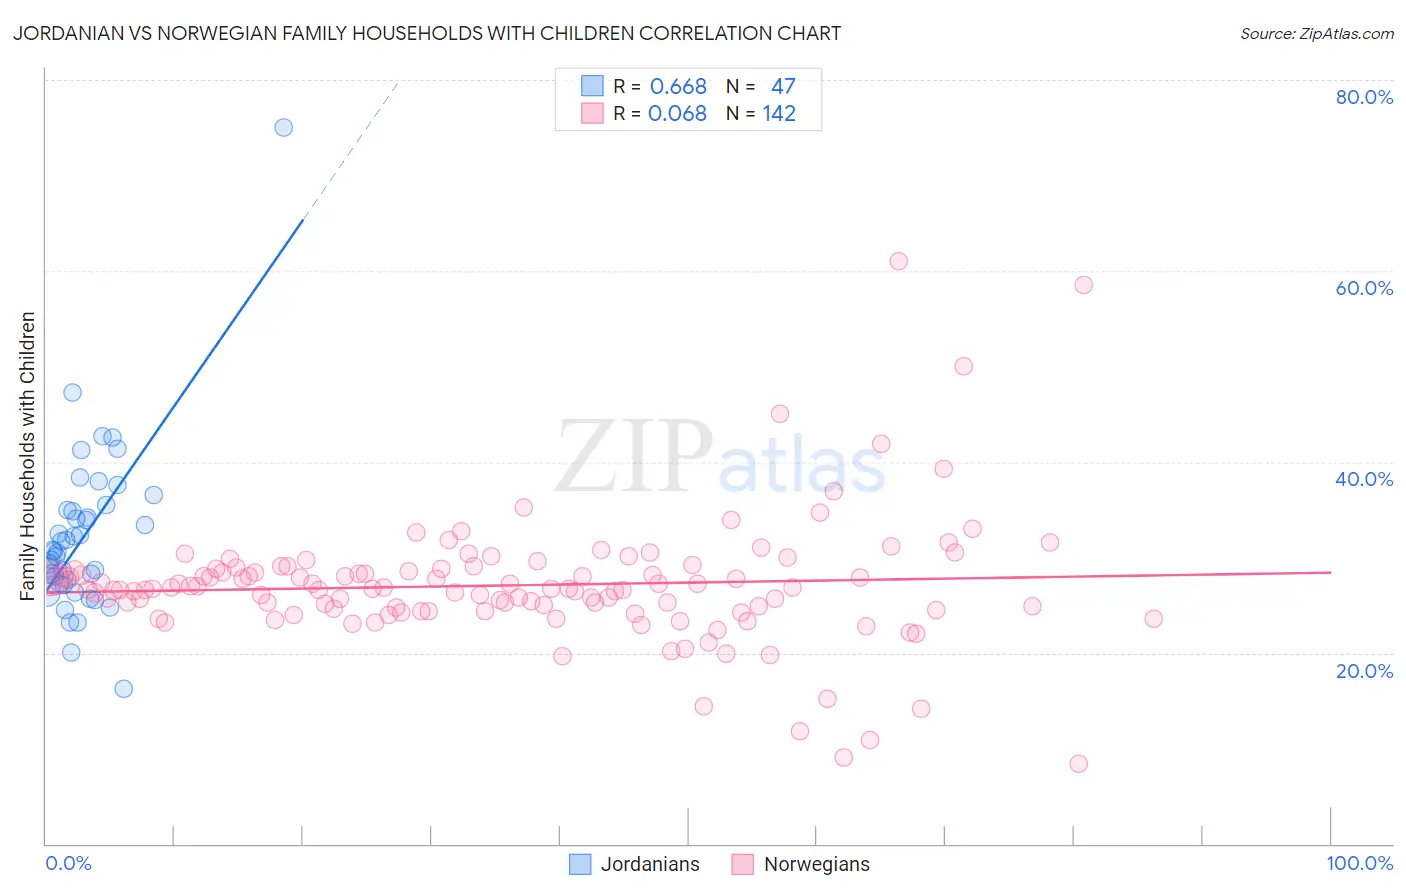
Jordanian vs Norwegian Family Households with Children Correlation Chart
The statistical analysis conducted on geographies consisting of 166,374,879 people shows a significant positive correlation between the proportion of Jordanians and percentage of family households with children in the United States with a correlation coefficient (R) of 0.668 and weighted average of 29.0%. Similarly, the statistical analysis conducted on geographies consisting of 532,567,428 people shows a slight positive correlation between the proportion of Norwegians and percentage of family households with children in the United States with a correlation coefficient (R) of 0.068 and weighted average of 27.4%, a difference of 5.9%.
Family Households with Children Correlation Summary
| Measurement | Jordanian | Norwegian |
| Minimum | 16.3% | 8.3% |
| Maximum | 75.0% | 61.1% |
| Range | 58.7% | 52.7% |
| Mean | 32.2% | 27.1% |
| Median | 30.6% | 26.7% |
| Interquartile 25% (IQ1) | 27.3% | 24.5% |
| Interquartile 75% (IQ3) | 34.9% | 28.8% |
| Interquartile Range (IQR) | 7.6% | 4.2% |
| Standard Deviation (Sample) | 8.9% | 6.7% |
| Standard Deviation (Population) | 8.8% | 6.7% |
Similar Demographics by Family Households with Children
Demographics Similar to Jordanians by Family Households with Children
In terms of family households with children, the demographic groups most similar to Jordanians are Apache (29.0%, a difference of 0.090%), Immigrants (28.9%, a difference of 0.11%), Peruvian (29.0%, a difference of 0.12%), Immigrants from Philippines (29.0%, a difference of 0.13%), and Immigrants from Peru (28.9%, a difference of 0.14%).
| Demographics | Rating | Rank | Family Households with Children |
| Spanish American Indians | 100.0 /100 | #42 | Exceptional 29.1% |
| Asians | 100.0 /100 | #43 | Exceptional 29.1% |
| Immigrants | Taiwan | 100.0 /100 | #44 | Exceptional 29.0% |
| Fijians | 100.0 /100 | #45 | Exceptional 29.0% |
| Immigrants | Philippines | 100.0 /100 | #46 | Exceptional 29.0% |
| Peruvians | 100.0 /100 | #47 | Exceptional 29.0% |
| Apache | 100.0 /100 | #48 | Exceptional 29.0% |
| Jordanians | 100.0 /100 | #49 | Exceptional 29.0% |
| Immigrants | Immigrants | 100.0 /100 | #50 | Exceptional 28.9% |
| Immigrants | Peru | 100.0 /100 | #51 | Exceptional 28.9% |
| Guatemalans | 100.0 /100 | #52 | Exceptional 28.9% |
| Immigrants | Cambodia | 100.0 /100 | #53 | Exceptional 28.9% |
| Sierra Leoneans | 100.0 /100 | #54 | Exceptional 28.9% |
| Immigrants | Asia | 100.0 /100 | #55 | Exceptional 28.8% |
| Immigrants | Guatemala | 100.0 /100 | #56 | Exceptional 28.8% |
Demographics Similar to Norwegians by Family Households with Children
In terms of family households with children, the demographic groups most similar to Norwegians are Cheyenne (27.4%, a difference of 0.0%), Immigrants from Romania (27.4%, a difference of 0.010%), Crow (27.4%, a difference of 0.020%), Immigrants from Iran (27.4%, a difference of 0.030%), and Swedish (27.4%, a difference of 0.050%).
| Demographics | Rating | Rank | Family Households with Children |
| Immigrants | Uruguay | 37.7 /100 | #190 | Fair 27.4% |
| Sudanese | 37.6 /100 | #191 | Fair 27.4% |
| Pennsylvania Germans | 37.5 /100 | #192 | Fair 27.4% |
| Swedes | 36.9 /100 | #193 | Fair 27.4% |
| Immigrants | Iran | 36.1 /100 | #194 | Fair 27.4% |
| Crow | 35.7 /100 | #195 | Fair 27.4% |
| Cheyenne | 35.1 /100 | #196 | Fair 27.4% |
| Norwegians | 35.0 /100 | #197 | Fair 27.4% |
| Immigrants | Romania | 34.4 /100 | #198 | Fair 27.4% |
| English | 32.0 /100 | #199 | Fair 27.3% |
| Immigrants | Congo | 28.7 /100 | #200 | Fair 27.3% |
| Bhutanese | 25.1 /100 | #201 | Fair 27.3% |
| Americans | 22.8 /100 | #202 | Fair 27.3% |
| Kiowa | 22.2 /100 | #203 | Fair 27.3% |
| Immigrants | Sudan | 21.6 /100 | #204 | Fair 27.3% |