Israeli vs Immigrants from Romania Single Mother Households
COMPARE
Israeli
Immigrants from Romania
Single Mother Households
Single Mother Households Comparison
Israelis
Immigrants from Romania
5.7%
SINGLE MOTHER HOUSEHOLDS
97.4/ 100
METRIC RATING
88th/ 347
METRIC RANK
5.5%
SINGLE MOTHER HOUSEHOLDS
99.0/ 100
METRIC RATING
56th/ 347
METRIC RANK
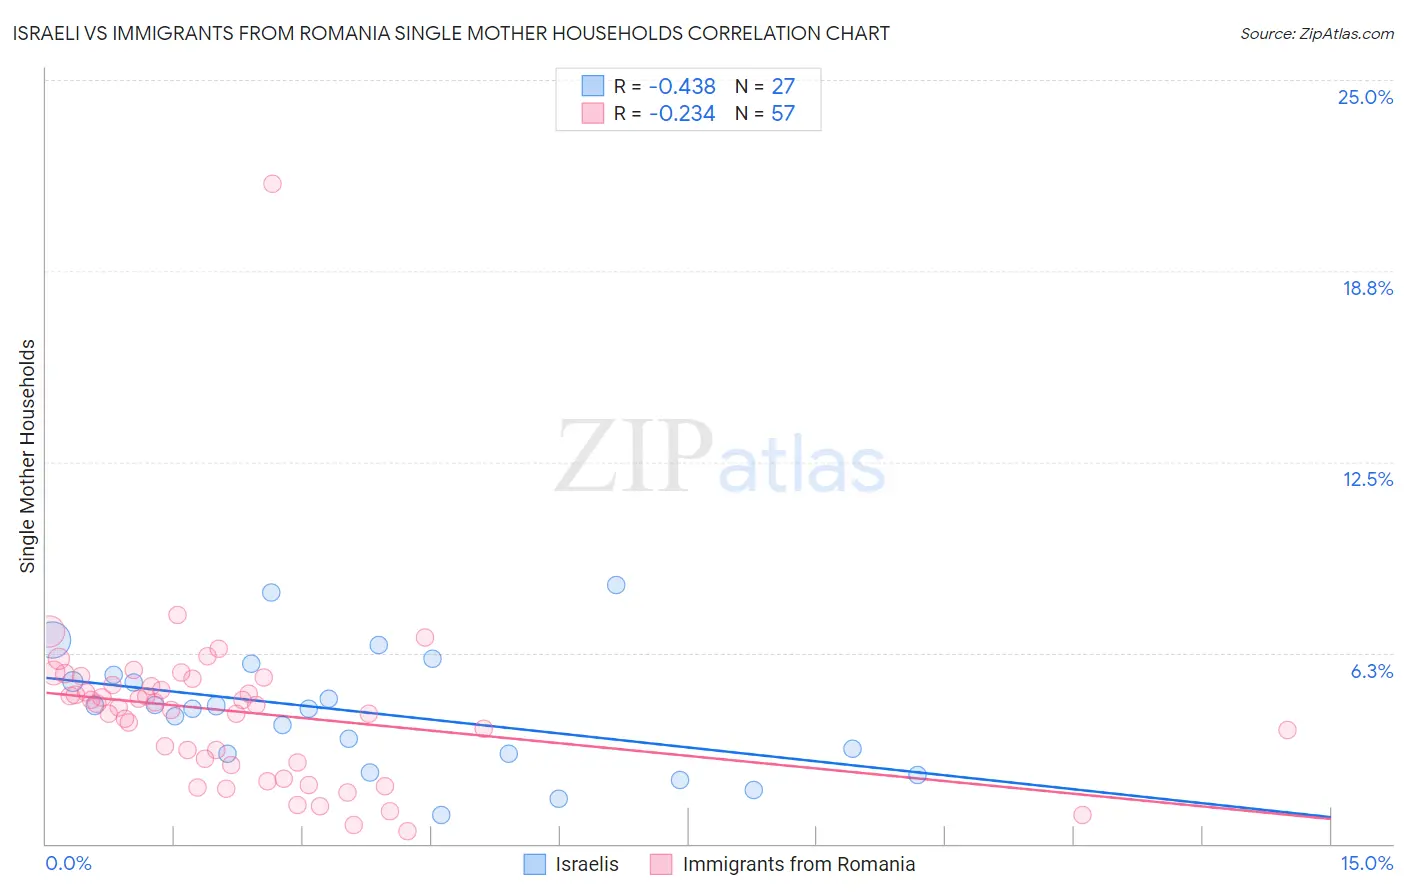
Israeli vs Immigrants from Romania Single Mother Households Correlation Chart
The statistical analysis conducted on geographies consisting of 210,568,675 people shows a moderate negative correlation between the proportion of Israelis and percentage of single mother households in the United States with a correlation coefficient (R) of -0.438 and weighted average of 5.7%. Similarly, the statistical analysis conducted on geographies consisting of 256,535,689 people shows a weak negative correlation between the proportion of Immigrants from Romania and percentage of single mother households in the United States with a correlation coefficient (R) of -0.234 and weighted average of 5.5%, a difference of 3.1%.
Single Mother Households Correlation Summary
| Measurement | Israeli | Immigrants from Romania |
| Minimum | 0.95% | 0.41% |
| Maximum | 8.5% | 21.6% |
| Range | 7.5% | 21.2% |
| Mean | 4.3% | 4.3% |
| Median | 4.4% | 4.6% |
| Interquartile 25% (IQ1) | 3.0% | 2.6% |
| Interquartile 75% (IQ3) | 5.5% | 5.3% |
| Interquartile Range (IQR) | 2.6% | 2.7% |
| Standard Deviation (Sample) | 1.9% | 2.9% |
| Standard Deviation (Population) | 1.9% | 2.9% |
Similar Demographics by Single Mother Households
Demographics Similar to Israelis by Single Mother Households
In terms of single mother households, the demographic groups most similar to Israelis are Immigrants from Turkey (5.7%, a difference of 0.070%), Finnish (5.7%, a difference of 0.15%), Hungarian (5.7%, a difference of 0.18%), Ukrainian (5.7%, a difference of 0.26%), and Immigrants from Indonesia (5.7%, a difference of 0.32%).
| Demographics | Rating | Rank | Single Mother Households |
| Immigrants | Moldova | 97.9 /100 | #81 | Exceptional 5.6% |
| Immigrants | Malaysia | 97.8 /100 | #82 | Exceptional 5.7% |
| Immigrants | Hungary | 97.8 /100 | #83 | Exceptional 5.7% |
| Carpatho Rusyns | 97.7 /100 | #84 | Exceptional 5.7% |
| Hungarians | 97.6 /100 | #85 | Exceptional 5.7% |
| Finns | 97.6 /100 | #86 | Exceptional 5.7% |
| Immigrants | Turkey | 97.5 /100 | #87 | Exceptional 5.7% |
| Israelis | 97.4 /100 | #88 | Exceptional 5.7% |
| Ukrainians | 97.2 /100 | #89 | Exceptional 5.7% |
| Immigrants | Indonesia | 97.2 /100 | #90 | Exceptional 5.7% |
| Europeans | 97.0 /100 | #91 | Exceptional 5.7% |
| Immigrants | Western Asia | 96.7 /100 | #92 | Exceptional 5.7% |
| Serbians | 96.7 /100 | #93 | Exceptional 5.7% |
| Basques | 96.7 /100 | #94 | Exceptional 5.7% |
| Slovaks | 96.6 /100 | #95 | Exceptional 5.7% |
Demographics Similar to Immigrants from Romania by Single Mother Households
In terms of single mother households, the demographic groups most similar to Immigrants from Romania are Immigrants from Denmark (5.5%, a difference of 0.070%), Immigrants from Europe (5.5%, a difference of 0.080%), Immigrants from Lebanon (5.5%, a difference of 0.24%), Immigrants from Russia (5.5%, a difference of 0.26%), and Danish (5.5%, a difference of 0.32%).
| Demographics | Rating | Rank | Single Mother Households |
| Immigrants | Latvia | 99.2 /100 | #49 | Exceptional 5.5% |
| Immigrants | Scotland | 99.2 /100 | #50 | Exceptional 5.5% |
| Immigrants | Belarus | 99.2 /100 | #51 | Exceptional 5.5% |
| Swedes | 99.1 /100 | #52 | Exceptional 5.5% |
| Immigrants | Russia | 99.1 /100 | #53 | Exceptional 5.5% |
| Immigrants | Lebanon | 99.1 /100 | #54 | Exceptional 5.5% |
| Immigrants | Denmark | 99.1 /100 | #55 | Exceptional 5.5% |
| Immigrants | Romania | 99.0 /100 | #56 | Exceptional 5.5% |
| Immigrants | Europe | 99.0 /100 | #57 | Exceptional 5.5% |
| Danes | 98.9 /100 | #58 | Exceptional 5.5% |
| Luxembourgers | 98.7 /100 | #59 | Exceptional 5.6% |
| Immigrants | Norway | 98.7 /100 | #60 | Exceptional 5.6% |
| Australians | 98.7 /100 | #61 | Exceptional 5.6% |
| Poles | 98.6 /100 | #62 | Exceptional 5.6% |
| Immigrants | North Macedonia | 98.6 /100 | #63 | Exceptional 5.6% |