Tohono O'odham vs Immigrants from Asia Single Mother Households
COMPARE
Tohono O'odham
Immigrants from Asia
Single Mother Households
Single Mother Households Comparison
Tohono O'odham
Immigrants from Asia
9.1%
SINGLE MOTHER HOUSEHOLDS
0.0/ 100
METRIC RATING
341st/ 347
METRIC RANK
5.6%
SINGLE MOTHER HOUSEHOLDS
98.4/ 100
METRIC RATING
73rd/ 347
METRIC RANK
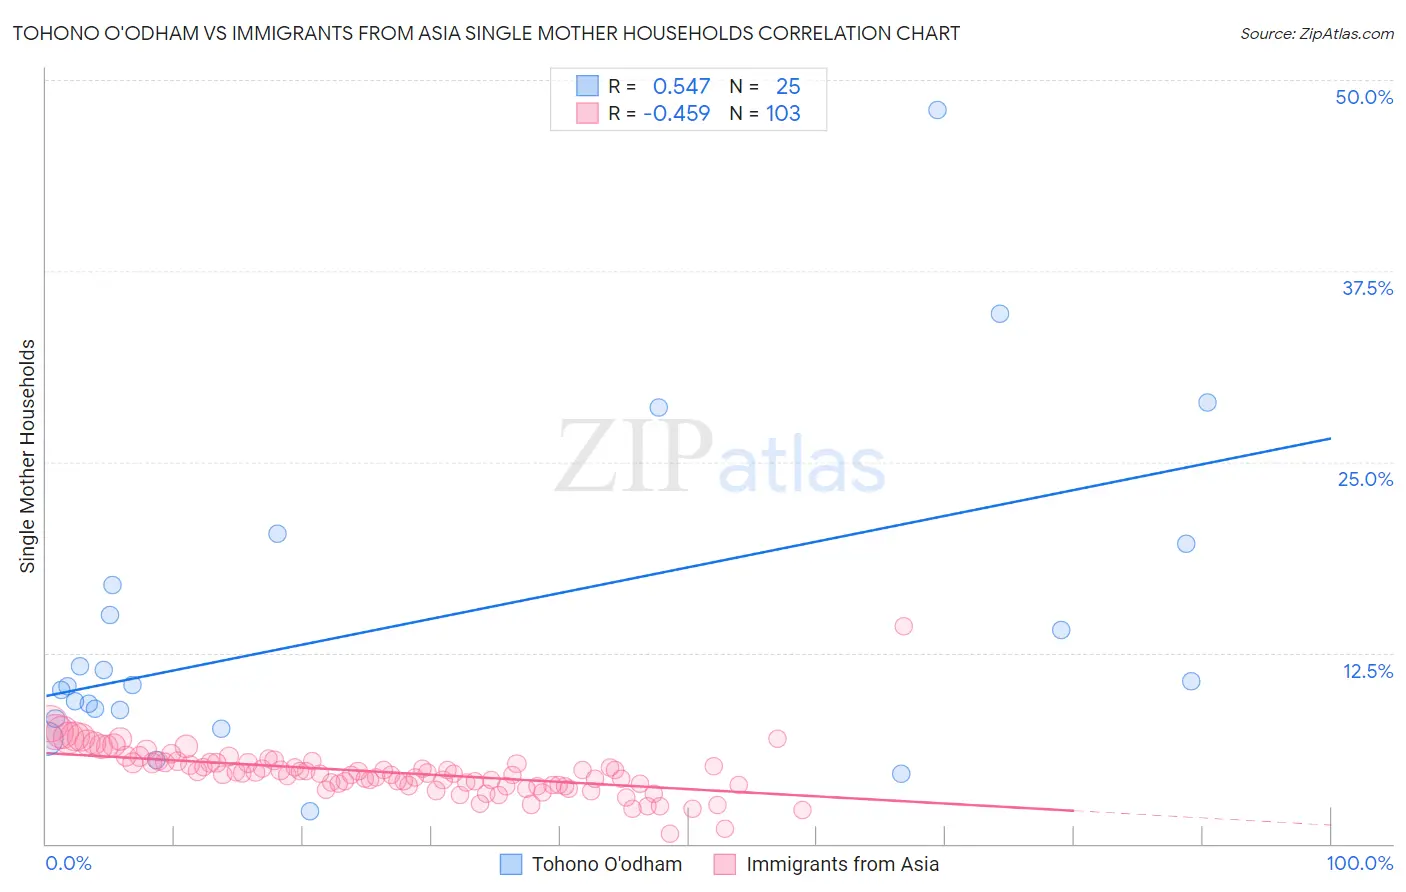
Tohono O'odham vs Immigrants from Asia Single Mother Households Correlation Chart
The statistical analysis conducted on geographies consisting of 58,690,271 people shows a substantial positive correlation between the proportion of Tohono O'odham and percentage of single mother households in the United States with a correlation coefficient (R) of 0.547 and weighted average of 9.1%. Similarly, the statistical analysis conducted on geographies consisting of 545,444,216 people shows a moderate negative correlation between the proportion of Immigrants from Asia and percentage of single mother households in the United States with a correlation coefficient (R) of -0.459 and weighted average of 5.6%, a difference of 63.0%.
Single Mother Households Correlation Summary
| Measurement | Tohono O'odham | Immigrants from Asia |
| Minimum | 2.1% | 0.63% |
| Maximum | 48.0% | 14.2% |
| Range | 45.9% | 13.6% |
| Mean | 14.4% | 4.7% |
| Median | 10.4% | 4.6% |
| Interquartile 25% (IQ1) | 8.5% | 3.8% |
| Interquartile 75% (IQ3) | 18.3% | 5.3% |
| Interquartile Range (IQR) | 9.8% | 1.5% |
| Standard Deviation (Sample) | 10.6% | 1.6% |
| Standard Deviation (Population) | 10.4% | 1.6% |
Similar Demographics by Single Mother Households
Demographics Similar to Tohono O'odham by Single Mother Households
In terms of single mother households, the demographic groups most similar to Tohono O'odham are Menominee (9.2%, a difference of 0.32%), Lumbee (9.1%, a difference of 0.36%), Dominican (9.2%, a difference of 0.53%), Black/African American (9.0%, a difference of 1.6%), and Cape Verdean (8.9%, a difference of 3.2%).
| Demographics | Rating | Rank | Single Mother Households |
| Liberians | 0.0 /100 | #333 | Tragic 8.6% |
| Immigrants | Liberia | 0.0 /100 | #334 | Tragic 8.7% |
| Immigrants | Dominica | 0.0 /100 | #335 | Tragic 8.7% |
| Puerto Ricans | 0.0 /100 | #336 | Tragic 8.7% |
| Navajo | 0.0 /100 | #337 | Tragic 8.8% |
| Cape Verdeans | 0.0 /100 | #338 | Tragic 8.9% |
| Blacks/African Americans | 0.0 /100 | #339 | Tragic 9.0% |
| Lumbee | 0.0 /100 | #340 | Tragic 9.1% |
| Tohono O'odham | 0.0 /100 | #341 | Tragic 9.1% |
| Menominee | 0.0 /100 | #342 | Tragic 9.2% |
| Dominicans | 0.0 /100 | #343 | Tragic 9.2% |
| Immigrants | Dominican Republic | 0.0 /100 | #344 | Tragic 9.5% |
| Immigrants | Cabo Verde | 0.0 /100 | #345 | Tragic 9.6% |
| Yuman | 0.0 /100 | #346 | Tragic 9.6% |
| Yup'ik | 0.0 /100 | #347 | Tragic 10.0% |
Demographics Similar to Immigrants from Asia by Single Mother Households
In terms of single mother households, the demographic groups most similar to Immigrants from Asia are Immigrants from North America (5.6%, a difference of 0.030%), Immigrants from Netherlands (5.6%, a difference of 0.060%), Immigrants from Kazakhstan (5.6%, a difference of 0.15%), Immigrants from Eastern Europe (5.6%, a difference of 0.16%), and Slovene (5.6%, a difference of 0.17%).
| Demographics | Rating | Rank | Single Mother Households |
| Immigrants | Canada | 98.5 /100 | #66 | Exceptional 5.6% |
| Italians | 98.5 /100 | #67 | Exceptional 5.6% |
| Immigrants | Bulgaria | 98.5 /100 | #68 | Exceptional 5.6% |
| Asians | 98.5 /100 | #69 | Exceptional 5.6% |
| Immigrants | Eastern Europe | 98.4 /100 | #70 | Exceptional 5.6% |
| Immigrants | Kazakhstan | 98.4 /100 | #71 | Exceptional 5.6% |
| Immigrants | Netherlands | 98.4 /100 | #72 | Exceptional 5.6% |
| Immigrants | Asia | 98.4 /100 | #73 | Exceptional 5.6% |
| Immigrants | North America | 98.3 /100 | #74 | Exceptional 5.6% |
| Slovenes | 98.3 /100 | #75 | Exceptional 5.6% |
| New Zealanders | 98.2 /100 | #76 | Exceptional 5.6% |
| Romanians | 98.1 /100 | #77 | Exceptional 5.6% |
| Swiss | 98.1 /100 | #78 | Exceptional 5.6% |
| Immigrants | Sri Lanka | 98.0 /100 | #79 | Exceptional 5.6% |
| Czechs | 97.9 /100 | #80 | Exceptional 5.6% |