Iraqi vs Immigrants from Poland Average Family Size
COMPARE
Iraqi
Immigrants from Poland
Average Family Size
Average Family Size Comparison
Iraqis
Immigrants from Poland
3.24
AVERAGE FAMILY SIZE
64.3/ 100
METRIC RATING
158th/ 347
METRIC RANK
3.20
AVERAGE FAMILY SIZE
16.6/ 100
METRIC RATING
204th/ 347
METRIC RANK
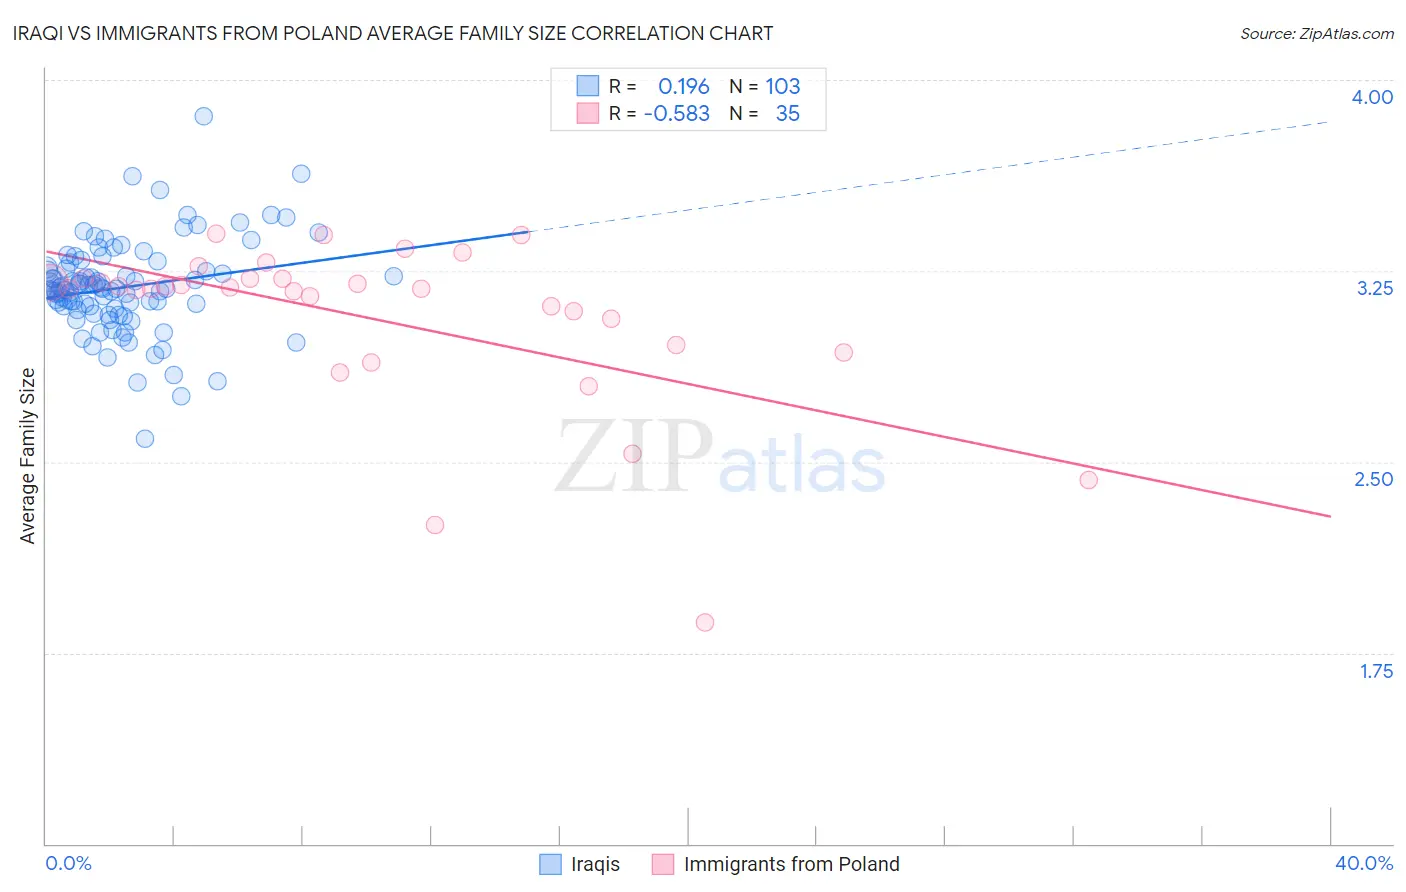
Iraqi vs Immigrants from Poland Average Family Size Correlation Chart
The statistical analysis conducted on geographies consisting of 170,567,061 people shows a poor positive correlation between the proportion of Iraqis and average family size in the United States with a correlation coefficient (R) of 0.196 and weighted average of 3.24. Similarly, the statistical analysis conducted on geographies consisting of 304,786,853 people shows a substantial negative correlation between the proportion of Immigrants from Poland and average family size in the United States with a correlation coefficient (R) of -0.583 and weighted average of 3.20, a difference of 1.0%.
Average Family Size Correlation Summary
| Measurement | Iraqi | Immigrants from Poland |
| Minimum | 2.59 | 1.87 |
| Maximum | 3.86 | 3.39 |
| Range | 1.27 | 1.52 |
| Mean | 3.19 | 3.06 |
| Median | 3.18 | 3.18 |
| Interquartile 25% (IQ1) | 3.10 | 2.96 |
| Interquartile 75% (IQ3) | 3.26 | 3.22 |
| Interquartile Range (IQR) | 0.16 | 0.26 |
| Standard Deviation (Sample) | 0.18 | 0.33 |
| Standard Deviation (Population) | 0.18 | 0.33 |
Similar Demographics by Average Family Size
Demographics Similar to Iraqis by Average Family Size
In terms of average family size, the demographic groups most similar to Iraqis are Ethiopian (3.24, a difference of 0.010%), Immigrants from Iraq (3.24, a difference of 0.010%), Immigrants from Chile (3.24, a difference of 0.020%), Immigrants from Uzbekistan (3.24, a difference of 0.050%), and Seminole (3.24, a difference of 0.080%).
| Demographics | Rating | Rank | Average Family Size |
| Jordanians | 73.5 /100 | #151 | Good 3.24 |
| Spanish Americans | 72.5 /100 | #152 | Good 3.24 |
| Immigrants | Eritrea | 71.4 /100 | #153 | Good 3.24 |
| Immigrants | Egypt | 70.0 /100 | #154 | Good 3.24 |
| Seminole | 68.2 /100 | #155 | Good 3.24 |
| Immigrants | Taiwan | 68.1 /100 | #156 | Good 3.24 |
| Immigrants | Uzbekistan | 67.0 /100 | #157 | Good 3.24 |
| Iraqis | 64.3 /100 | #158 | Good 3.24 |
| Ethiopians | 63.9 /100 | #159 | Good 3.24 |
| Immigrants | Iraq | 63.7 /100 | #160 | Good 3.24 |
| Immigrants | Chile | 63.2 /100 | #161 | Good 3.24 |
| Immigrants | Uganda | 60.1 /100 | #162 | Good 3.23 |
| Uruguayans | 58.8 /100 | #163 | Average 3.23 |
| Egyptians | 58.6 /100 | #164 | Average 3.23 |
| Ugandans | 58.4 /100 | #165 | Average 3.23 |
Demographics Similar to Immigrants from Poland by Average Family Size
In terms of average family size, the demographic groups most similar to Immigrants from Poland are Paraguayan (3.20, a difference of 0.010%), Immigrants from Cabo Verde (3.20, a difference of 0.020%), Immigrants from Nepal (3.21, a difference of 0.050%), Immigrants from Morocco (3.21, a difference of 0.060%), and Immigrants from India (3.21, a difference of 0.060%).
| Demographics | Rating | Rank | Average Family Size |
| Kenyans | 28.0 /100 | #197 | Fair 3.21 |
| Immigrants | Azores | 21.7 /100 | #198 | Fair 3.21 |
| Hmong | 20.7 /100 | #199 | Fair 3.21 |
| Immigrants | Kenya | 19.2 /100 | #200 | Poor 3.21 |
| Immigrants | Morocco | 18.5 /100 | #201 | Poor 3.21 |
| Immigrants | India | 18.5 /100 | #202 | Poor 3.21 |
| Immigrants | Nepal | 18.1 /100 | #203 | Poor 3.21 |
| Immigrants | Poland | 16.6 /100 | #204 | Poor 3.20 |
| Paraguayans | 16.3 /100 | #205 | Poor 3.20 |
| Immigrants | Cabo Verde | 16.0 /100 | #206 | Poor 3.20 |
| Filipinos | 13.6 /100 | #207 | Poor 3.20 |
| Chippewa | 13.3 /100 | #208 | Poor 3.20 |
| Sudanese | 13.3 /100 | #209 | Poor 3.20 |
| Zimbabweans | 12.6 /100 | #210 | Poor 3.20 |
| Immigrants | Iran | 12.1 /100 | #211 | Poor 3.20 |