English vs Syrian Family Households with Children
COMPARE
English
Syrian
Family Households with Children
Family Households with Children Comparison
English
Syrians
27.3%
FAMILY HOUSEHOLDS WITH CHILDREN
32.0/ 100
METRIC RATING
199th/ 347
METRIC RANK
27.8%
FAMILY HOUSEHOLDS WITH CHILDREN
89.7/ 100
METRIC RATING
128th/ 347
METRIC RANK
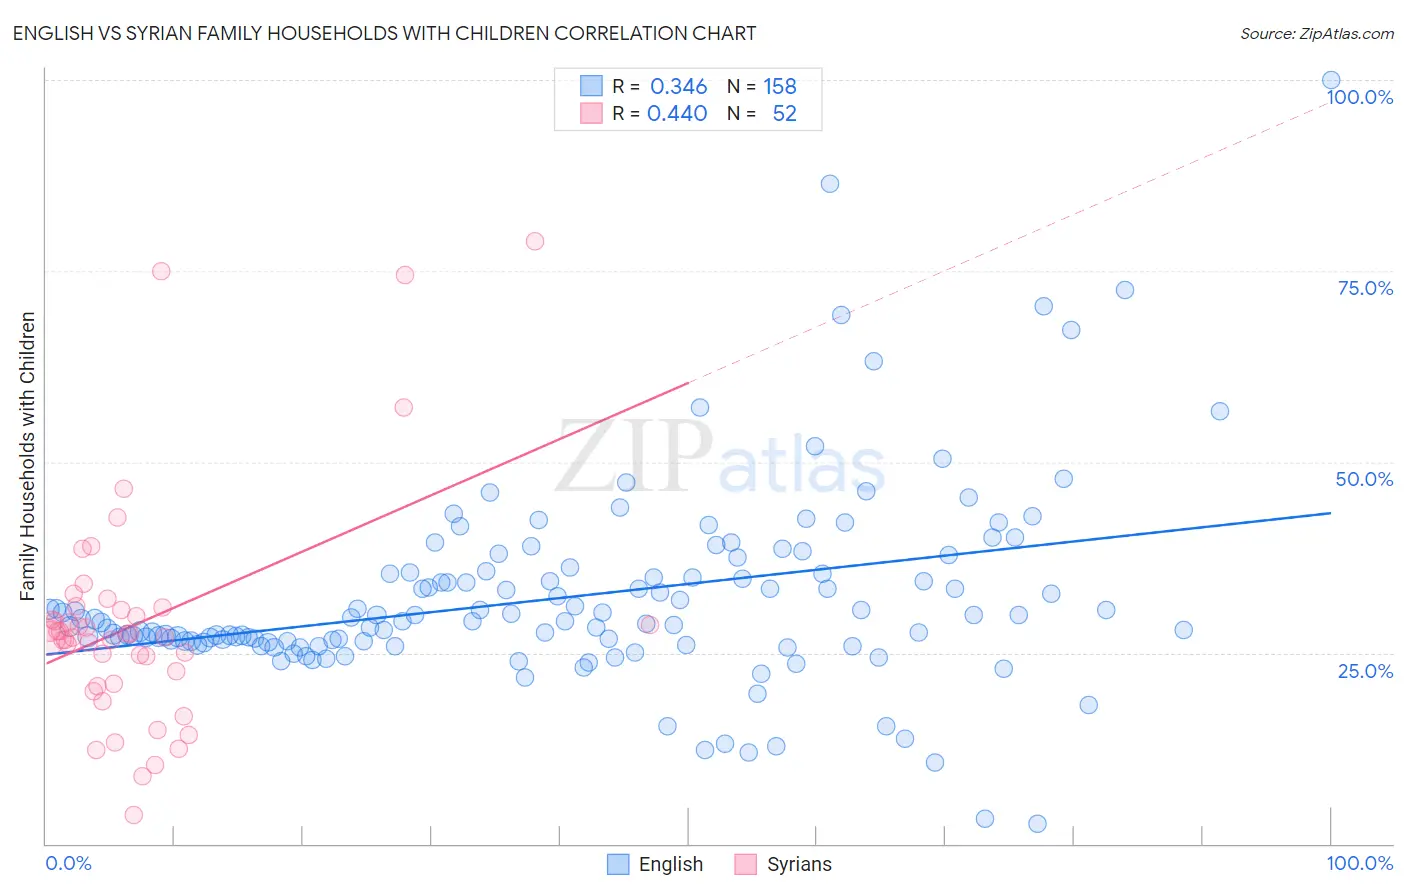
English vs Syrian Family Households with Children Correlation Chart
The statistical analysis conducted on geographies consisting of 578,706,985 people shows a mild positive correlation between the proportion of English and percentage of family households with children in the United States with a correlation coefficient (R) of 0.346 and weighted average of 27.3%. Similarly, the statistical analysis conducted on geographies consisting of 266,095,178 people shows a moderate positive correlation between the proportion of Syrians and percentage of family households with children in the United States with a correlation coefficient (R) of 0.440 and weighted average of 27.8%, a difference of 1.6%.
Family Households with Children Correlation Summary
| Measurement | English | Syrian |
| Minimum | 2.7% | 3.8% |
| Maximum | 100.0% | 78.9% |
| Range | 97.3% | 75.1% |
| Mean | 32.2% | 29.0% |
| Median | 29.2% | 27.2% |
| Interquartile 25% (IQ1) | 26.5% | 21.8% |
| Interquartile 75% (IQ3) | 35.4% | 30.8% |
| Interquartile Range (IQR) | 8.9% | 8.9% |
| Standard Deviation (Sample) | 12.9% | 15.0% |
| Standard Deviation (Population) | 12.9% | 14.8% |
Similar Demographics by Family Households with Children
Demographics Similar to English by Family Households with Children
In terms of family households with children, the demographic groups most similar to English are Immigrants from Romania (27.4%, a difference of 0.060%), Norwegian (27.4%, a difference of 0.070%), Cheyenne (27.4%, a difference of 0.080%), Crow (27.4%, a difference of 0.090%), and Immigrants from Congo (27.3%, a difference of 0.090%).
| Demographics | Rating | Rank | Family Households with Children |
| Pennsylvania Germans | 37.5 /100 | #192 | Fair 27.4% |
| Swedes | 36.9 /100 | #193 | Fair 27.4% |
| Immigrants | Iran | 36.1 /100 | #194 | Fair 27.4% |
| Crow | 35.7 /100 | #195 | Fair 27.4% |
| Cheyenne | 35.1 /100 | #196 | Fair 27.4% |
| Norwegians | 35.0 /100 | #197 | Fair 27.4% |
| Immigrants | Romania | 34.4 /100 | #198 | Fair 27.4% |
| English | 32.0 /100 | #199 | Fair 27.3% |
| Immigrants | Congo | 28.7 /100 | #200 | Fair 27.3% |
| Bhutanese | 25.1 /100 | #201 | Fair 27.3% |
| Americans | 22.8 /100 | #202 | Fair 27.3% |
| Kiowa | 22.2 /100 | #203 | Fair 27.3% |
| Immigrants | Sudan | 21.6 /100 | #204 | Fair 27.3% |
| Immigrants | Haiti | 20.3 /100 | #205 | Fair 27.2% |
| Immigrants | Micronesia | 20.2 /100 | #206 | Fair 27.2% |
Demographics Similar to Syrians by Family Households with Children
In terms of family households with children, the demographic groups most similar to Syrians are Belizean (27.8%, a difference of 0.020%), Immigrants from Eritrea (27.8%, a difference of 0.020%), Immigrants from Ethiopia (27.8%, a difference of 0.050%), Immigrants from Singapore (27.8%, a difference of 0.070%), and Ecuadorian (27.8%, a difference of 0.070%).
| Demographics | Rating | Rank | Family Households with Children |
| Immigrants | Western Asia | 93.6 /100 | #121 | Exceptional 27.9% |
| Immigrants | Zimbabwe | 92.8 /100 | #122 | Exceptional 27.8% |
| Immigrants | Northern Africa | 91.8 /100 | #123 | Exceptional 27.8% |
| Immigrants | Singapore | 90.8 /100 | #124 | Exceptional 27.8% |
| Ecuadorians | 90.8 /100 | #125 | Exceptional 27.8% |
| Immigrants | Ethiopia | 90.5 /100 | #126 | Exceptional 27.8% |
| Belizeans | 90.0 /100 | #127 | Exceptional 27.8% |
| Syrians | 89.7 /100 | #128 | Excellent 27.8% |
| Immigrants | Eritrea | 89.4 /100 | #129 | Excellent 27.8% |
| Cajuns | 87.6 /100 | #130 | Excellent 27.7% |
| Lebanese | 87.4 /100 | #131 | Excellent 27.7% |
| Immigrants | Belize | 85.7 /100 | #132 | Excellent 27.7% |
| Iranians | 85.2 /100 | #133 | Excellent 27.7% |
| Immigrants | Panama | 84.9 /100 | #134 | Excellent 27.7% |
| Immigrants | Ecuador | 84.6 /100 | #135 | Excellent 27.7% |