Iranian vs Assyrian/Chaldean/Syriac Family Households with Children
COMPARE
Iranian
Assyrian/Chaldean/Syriac
Family Households with Children
Family Households with Children Comparison
Iranians
Assyrians/Chaldeans/Syriacs
27.7%
FAMILY HOUSEHOLDS WITH CHILDREN
85.2/ 100
METRIC RATING
133rd/ 347
METRIC RANK
28.1%
FAMILY HOUSEHOLDS WITH CHILDREN
98.7/ 100
METRIC RATING
102nd/ 347
METRIC RANK
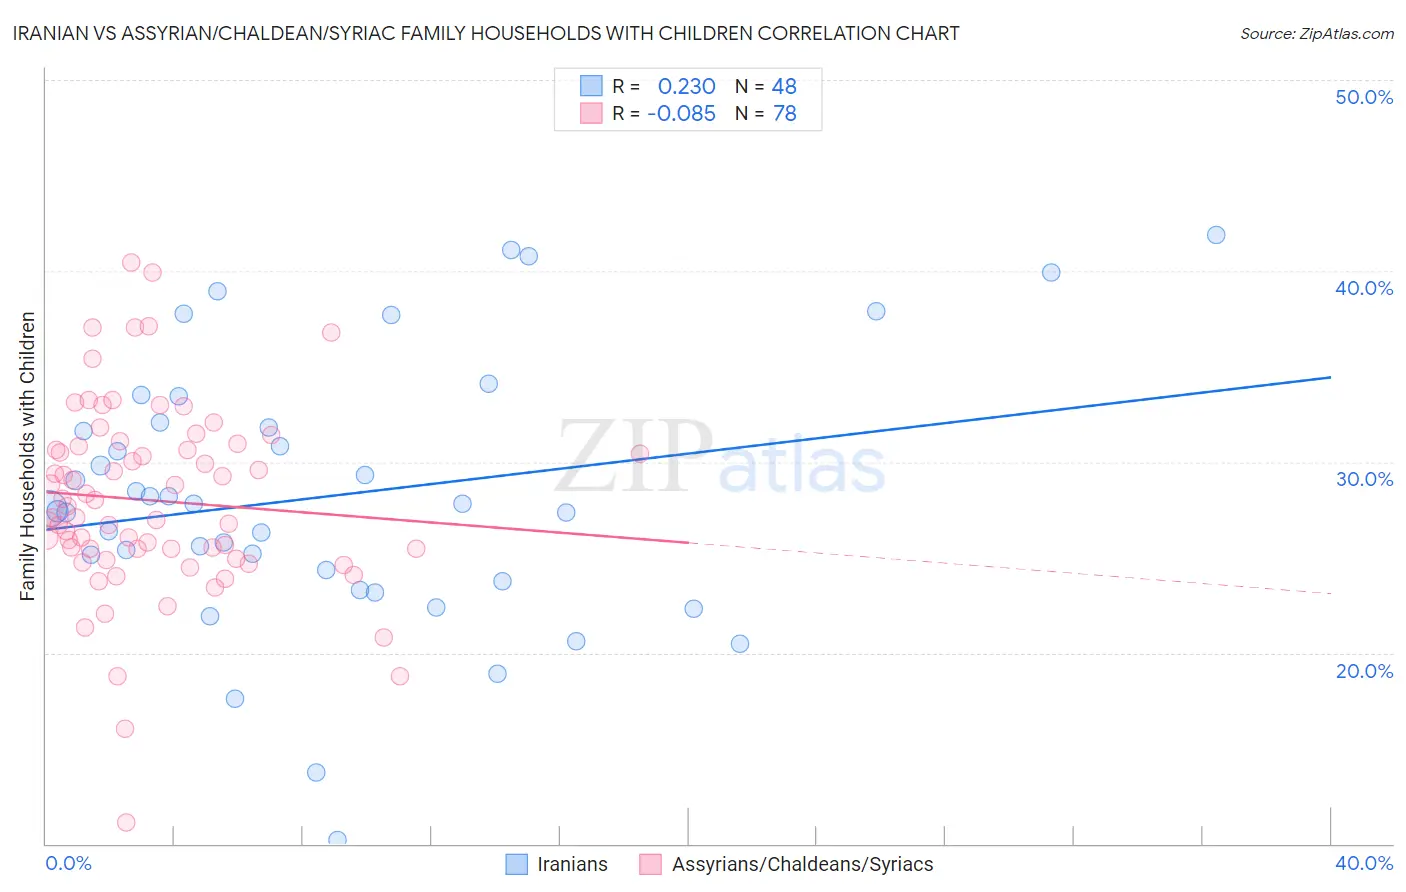
Iranian vs Assyrian/Chaldean/Syriac Family Households with Children Correlation Chart
The statistical analysis conducted on geographies consisting of 316,530,986 people shows a weak positive correlation between the proportion of Iranians and percentage of family households with children in the United States with a correlation coefficient (R) of 0.230 and weighted average of 27.7%. Similarly, the statistical analysis conducted on geographies consisting of 110,282,118 people shows a slight negative correlation between the proportion of Assyrians/Chaldeans/Syriacs and percentage of family households with children in the United States with a correlation coefficient (R) of -0.085 and weighted average of 28.1%, a difference of 1.4%.
Family Households with Children Correlation Summary
| Measurement | Iranian | Assyrian/Chaldean/Syriac |
| Minimum | 10.2% | 11.1% |
| Maximum | 41.9% | 40.5% |
| Range | 31.7% | 29.4% |
| Mean | 28.2% | 28.0% |
| Median | 27.7% | 27.4% |
| Interquartile 25% (IQ1) | 24.0% | 25.4% |
| Interquartile 75% (IQ3) | 31.9% | 30.8% |
| Interquartile Range (IQR) | 7.9% | 5.4% |
| Standard Deviation (Sample) | 7.0% | 5.0% |
| Standard Deviation (Population) | 6.9% | 5.0% |
Similar Demographics by Family Households with Children
Demographics Similar to Iranians by Family Households with Children
In terms of family households with children, the demographic groups most similar to Iranians are Immigrants from Panama (27.7%, a difference of 0.010%), Immigrants from Belize (27.7%, a difference of 0.020%), Immigrants from Ecuador (27.7%, a difference of 0.030%), Immigrants from Portugal (27.7%, a difference of 0.040%), and Immigrants from Dominican Republic (27.7%, a difference of 0.060%).
| Demographics | Rating | Rank | Family Households with Children |
| Immigrants | Ethiopia | 90.5 /100 | #126 | Exceptional 27.8% |
| Belizeans | 90.0 /100 | #127 | Exceptional 27.8% |
| Syrians | 89.7 /100 | #128 | Excellent 27.8% |
| Immigrants | Eritrea | 89.4 /100 | #129 | Excellent 27.8% |
| Cajuns | 87.6 /100 | #130 | Excellent 27.7% |
| Lebanese | 87.4 /100 | #131 | Excellent 27.7% |
| Immigrants | Belize | 85.7 /100 | #132 | Excellent 27.7% |
| Iranians | 85.2 /100 | #133 | Excellent 27.7% |
| Immigrants | Panama | 84.9 /100 | #134 | Excellent 27.7% |
| Immigrants | Ecuador | 84.6 /100 | #135 | Excellent 27.7% |
| Immigrants | Portugal | 84.1 /100 | #136 | Excellent 27.7% |
| Immigrants | Dominican Republic | 83.9 /100 | #137 | Excellent 27.7% |
| Uruguayans | 83.2 /100 | #138 | Excellent 27.7% |
| Vietnamese | 82.6 /100 | #139 | Excellent 27.7% |
| Spanish | 81.8 /100 | #140 | Excellent 27.7% |
Demographics Similar to Assyrians/Chaldeans/Syriacs by Family Households with Children
In terms of family households with children, the demographic groups most similar to Assyrians/Chaldeans/Syriacs are Immigrants from Oceania (28.1%, a difference of 0.030%), Immigrants from the Azores (28.1%, a difference of 0.050%), Indonesian (28.1%, a difference of 0.050%), Immigrants from Kenya (28.1%, a difference of 0.060%), and Chilean (28.1%, a difference of 0.10%).
| Demographics | Rating | Rank | Family Households with Children |
| Immigrants | Nicaragua | 99.1 /100 | #95 | Exceptional 28.2% |
| Ute | 99.1 /100 | #96 | Exceptional 28.2% |
| Chileans | 98.9 /100 | #97 | Exceptional 28.1% |
| Immigrants | Kenya | 98.9 /100 | #98 | Exceptional 28.1% |
| Immigrants | Azores | 98.8 /100 | #99 | Exceptional 28.1% |
| Indonesians | 98.8 /100 | #100 | Exceptional 28.1% |
| Immigrants | Oceania | 98.8 /100 | #101 | Exceptional 28.1% |
| Assyrians/Chaldeans/Syriacs | 98.7 /100 | #102 | Exceptional 28.1% |
| Palestinians | 98.5 /100 | #103 | Exceptional 28.1% |
| Sioux | 98.3 /100 | #104 | Exceptional 28.1% |
| Choctaw | 98.3 /100 | #105 | Exceptional 28.1% |
| Immigrants | South America | 98.0 /100 | #106 | Exceptional 28.0% |
| Immigrants | Uganda | 97.7 /100 | #107 | Exceptional 28.0% |
| Immigrants | Burma/Myanmar | 97.7 /100 | #108 | Exceptional 28.0% |
| Tohono O'odham | 97.6 /100 | #109 | Exceptional 28.0% |