Chilean vs Syrian Family Households with Children
COMPARE
Chilean
Syrian
Family Households with Children
Family Households with Children Comparison
Chileans
Syrians
28.1%
FAMILY HOUSEHOLDS WITH CHILDREN
98.9/ 100
METRIC RATING
97th/ 347
METRIC RANK
27.8%
FAMILY HOUSEHOLDS WITH CHILDREN
89.7/ 100
METRIC RATING
128th/ 347
METRIC RANK
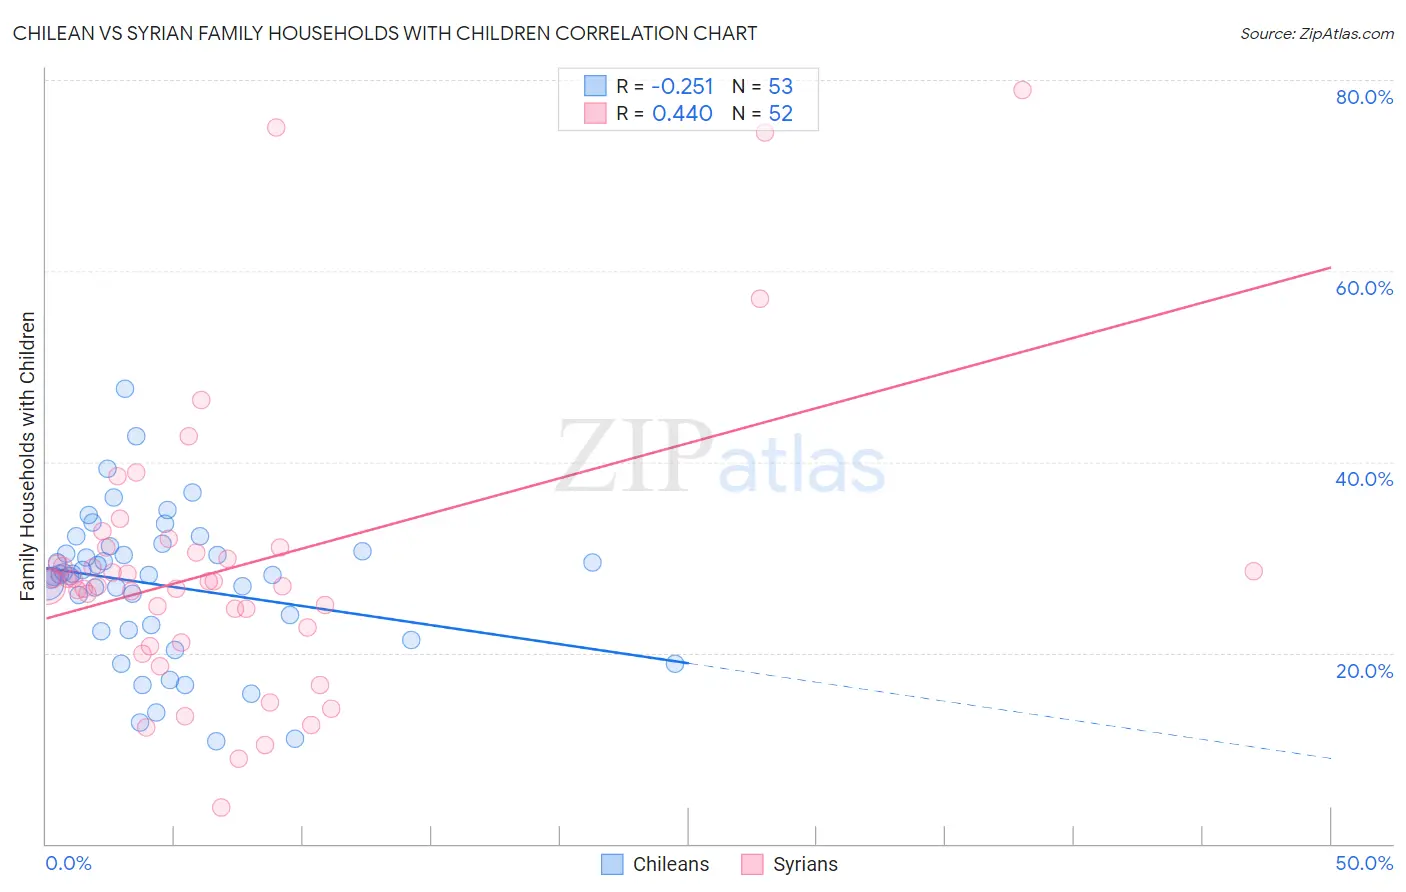
Chilean vs Syrian Family Households with Children Correlation Chart
The statistical analysis conducted on geographies consisting of 256,524,763 people shows a weak negative correlation between the proportion of Chileans and percentage of family households with children in the United States with a correlation coefficient (R) of -0.251 and weighted average of 28.1%. Similarly, the statistical analysis conducted on geographies consisting of 266,095,178 people shows a moderate positive correlation between the proportion of Syrians and percentage of family households with children in the United States with a correlation coefficient (R) of 0.440 and weighted average of 27.8%, a difference of 1.3%.
Family Households with Children Correlation Summary
| Measurement | Chilean | Syrian |
| Minimum | 10.7% | 3.8% |
| Maximum | 47.6% | 78.9% |
| Range | 36.9% | 75.1% |
| Mean | 27.1% | 29.0% |
| Median | 28.1% | 27.2% |
| Interquartile 25% (IQ1) | 22.3% | 21.8% |
| Interquartile 75% (IQ3) | 30.9% | 30.8% |
| Interquartile Range (IQR) | 8.6% | 8.9% |
| Standard Deviation (Sample) | 7.6% | 15.0% |
| Standard Deviation (Population) | 7.5% | 14.8% |
Similar Demographics by Family Households with Children
Demographics Similar to Chileans by Family Households with Children
In terms of family households with children, the demographic groups most similar to Chileans are Immigrants from Kenya (28.1%, a difference of 0.040%), Immigrants from the Azores (28.1%, a difference of 0.050%), Ute (28.2%, a difference of 0.060%), Indonesian (28.1%, a difference of 0.060%), and Immigrants from Nicaragua (28.2%, a difference of 0.080%).
| Demographics | Rating | Rank | Family Households with Children |
| Immigrants | Thailand | 99.5 /100 | #90 | Exceptional 28.2% |
| Immigrants | Liberia | 99.4 /100 | #91 | Exceptional 28.2% |
| Chickasaw | 99.4 /100 | #92 | Exceptional 28.2% |
| Panamanians | 99.3 /100 | #93 | Exceptional 28.2% |
| Immigrants | Colombia | 99.2 /100 | #94 | Exceptional 28.2% |
| Immigrants | Nicaragua | 99.1 /100 | #95 | Exceptional 28.2% |
| Ute | 99.1 /100 | #96 | Exceptional 28.2% |
| Chileans | 98.9 /100 | #97 | Exceptional 28.1% |
| Immigrants | Kenya | 98.9 /100 | #98 | Exceptional 28.1% |
| Immigrants | Azores | 98.8 /100 | #99 | Exceptional 28.1% |
| Indonesians | 98.8 /100 | #100 | Exceptional 28.1% |
| Immigrants | Oceania | 98.8 /100 | #101 | Exceptional 28.1% |
| Assyrians/Chaldeans/Syriacs | 98.7 /100 | #102 | Exceptional 28.1% |
| Palestinians | 98.5 /100 | #103 | Exceptional 28.1% |
| Sioux | 98.3 /100 | #104 | Exceptional 28.1% |
Demographics Similar to Syrians by Family Households with Children
In terms of family households with children, the demographic groups most similar to Syrians are Belizean (27.8%, a difference of 0.020%), Immigrants from Eritrea (27.8%, a difference of 0.020%), Immigrants from Ethiopia (27.8%, a difference of 0.050%), Immigrants from Singapore (27.8%, a difference of 0.070%), and Ecuadorian (27.8%, a difference of 0.070%).
| Demographics | Rating | Rank | Family Households with Children |
| Immigrants | Western Asia | 93.6 /100 | #121 | Exceptional 27.9% |
| Immigrants | Zimbabwe | 92.8 /100 | #122 | Exceptional 27.8% |
| Immigrants | Northern Africa | 91.8 /100 | #123 | Exceptional 27.8% |
| Immigrants | Singapore | 90.8 /100 | #124 | Exceptional 27.8% |
| Ecuadorians | 90.8 /100 | #125 | Exceptional 27.8% |
| Immigrants | Ethiopia | 90.5 /100 | #126 | Exceptional 27.8% |
| Belizeans | 90.0 /100 | #127 | Exceptional 27.8% |
| Syrians | 89.7 /100 | #128 | Excellent 27.8% |
| Immigrants | Eritrea | 89.4 /100 | #129 | Excellent 27.8% |
| Cajuns | 87.6 /100 | #130 | Excellent 27.7% |
| Lebanese | 87.4 /100 | #131 | Excellent 27.7% |
| Immigrants | Belize | 85.7 /100 | #132 | Excellent 27.7% |
| Iranians | 85.2 /100 | #133 | Excellent 27.7% |
| Immigrants | Panama | 84.9 /100 | #134 | Excellent 27.7% |
| Immigrants | Ecuador | 84.6 /100 | #135 | Excellent 27.7% |