Immigrants from Fiji vs Fijian Births to Unmarried Women
COMPARE
Immigrants from Fiji
Fijian
Births to Unmarried Women
Births to Unmarried Women Comparison
Immigrants from Fiji
Fijians
29.2%
BIRTHS TO UNMARRIED WOMEN
96.6/ 100
METRIC RATING
91st/ 347
METRIC RANK
32.3%
BIRTHS TO UNMARRIED WOMEN
31.1/ 100
METRIC RATING
193rd/ 347
METRIC RANK
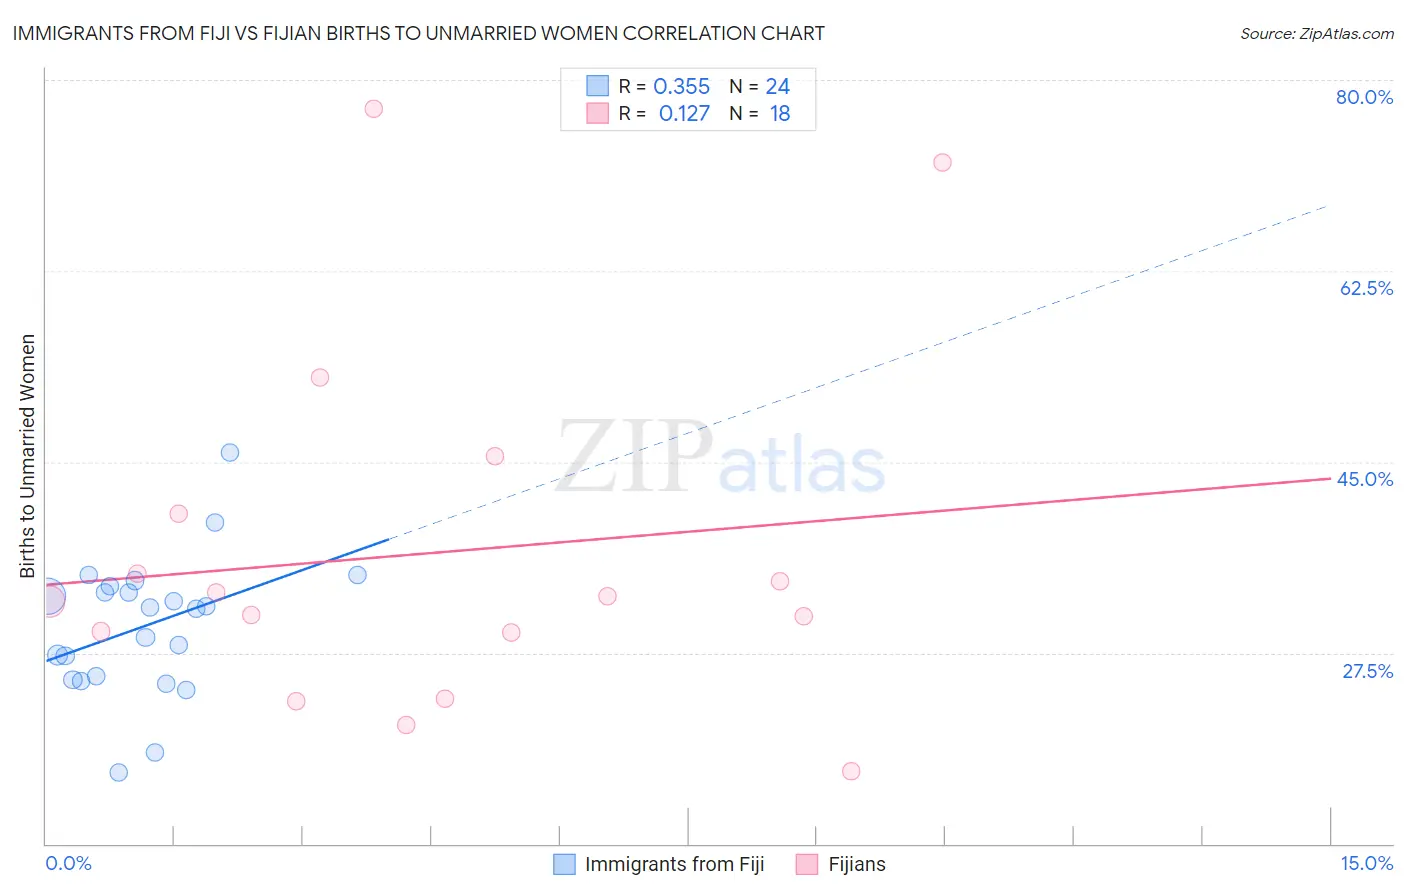
Immigrants from Fiji vs Fijian Births to Unmarried Women Correlation Chart
The statistical analysis conducted on geographies consisting of 91,931,577 people shows a mild positive correlation between the proportion of Immigrants from Fiji and percentage of births to unmarried women in the United States with a correlation coefficient (R) of 0.355 and weighted average of 29.2%. Similarly, the statistical analysis conducted on geographies consisting of 54,941,736 people shows a poor positive correlation between the proportion of Fijians and percentage of births to unmarried women in the United States with a correlation coefficient (R) of 0.127 and weighted average of 32.3%, a difference of 10.6%.
Births to Unmarried Women Correlation Summary
| Measurement | Immigrants from Fiji | Fijian |
| Minimum | 16.5% | 16.7% |
| Maximum | 45.9% | 77.3% |
| Range | 29.3% | 60.6% |
| Mean | 30.0% | 36.6% |
| Median | 31.6% | 32.4% |
| Interquartile 25% (IQ1) | 25.2% | 29.4% |
| Interquartile 75% (IQ3) | 33.4% | 40.3% |
| Interquartile Range (IQR) | 8.1% | 10.9% |
| Standard Deviation (Sample) | 6.3% | 16.3% |
| Standard Deviation (Population) | 6.2% | 15.8% |
Similar Demographics by Births to Unmarried Women
Demographics Similar to Immigrants from Fiji by Births to Unmarried Women
In terms of births to unmarried women, the demographic groups most similar to Immigrants from Fiji are Arab (29.2%, a difference of 0.040%), Estonian (29.2%, a difference of 0.080%), Ukrainian (29.2%, a difference of 0.20%), Immigrants from Latvia (29.1%, a difference of 0.21%), and Immigrants from Vietnam (29.3%, a difference of 0.34%).
| Demographics | Rating | Rank | Births to Unmarried Women |
| Immigrants | Poland | 97.6 /100 | #84 | Exceptional 28.9% |
| Sri Lankans | 97.5 /100 | #85 | Exceptional 28.9% |
| Immigrants | Jordan | 97.4 /100 | #86 | Exceptional 29.0% |
| Taiwanese | 97.3 /100 | #87 | Exceptional 29.0% |
| Immigrants | France | 97.3 /100 | #88 | Exceptional 29.0% |
| Immigrants | Saudi Arabia | 97.0 /100 | #89 | Exceptional 29.1% |
| Immigrants | Latvia | 96.8 /100 | #90 | Exceptional 29.1% |
| Immigrants | Fiji | 96.6 /100 | #91 | Exceptional 29.2% |
| Arabs | 96.5 /100 | #92 | Exceptional 29.2% |
| Estonians | 96.5 /100 | #93 | Exceptional 29.2% |
| Ukrainians | 96.3 /100 | #94 | Exceptional 29.2% |
| Immigrants | Vietnam | 96.1 /100 | #95 | Exceptional 29.3% |
| Norwegians | 95.8 /100 | #96 | Exceptional 29.3% |
| Immigrants | South Africa | 95.7 /100 | #97 | Exceptional 29.3% |
| Immigrants | Syria | 95.7 /100 | #98 | Exceptional 29.4% |
Demographics Similar to Fijians by Births to Unmarried Women
In terms of births to unmarried women, the demographic groups most similar to Fijians are Colombian (32.2%, a difference of 0.090%), Irish (32.2%, a difference of 0.14%), Tlingit-Haida (32.2%, a difference of 0.17%), Sudanese (32.4%, a difference of 0.42%), and Immigrants from Kenya (32.1%, a difference of 0.61%).
| Demographics | Rating | Rank | Births to Unmarried Women |
| Welsh | 38.2 /100 | #186 | Fair 32.0% |
| Czechoslovakians | 38.0 /100 | #187 | Fair 32.0% |
| Osage | 37.1 /100 | #188 | Fair 32.1% |
| Immigrants | Kenya | 36.9 /100 | #189 | Fair 32.1% |
| Tlingit-Haida | 32.6 /100 | #190 | Fair 32.2% |
| Irish | 32.4 /100 | #191 | Fair 32.2% |
| Colombians | 31.9 /100 | #192 | Fair 32.2% |
| Fijians | 31.1 /100 | #193 | Fair 32.3% |
| Sudanese | 27.3 /100 | #194 | Fair 32.4% |
| Samoans | 21.9 /100 | #195 | Fair 32.6% |
| Immigrants | Colombia | 21.7 /100 | #196 | Fair 32.6% |
| Immigrants | Immigrants | 20.6 /100 | #197 | Fair 32.7% |
| Costa Ricans | 20.3 /100 | #198 | Fair 32.7% |
| Immigrants | Thailand | 18.9 /100 | #199 | Poor 32.8% |
| Immigrants | Germany | 18.8 /100 | #200 | Poor 32.8% |