Inupiat vs Immigrants from Serbia Births to Unmarried Women
COMPARE
Inupiat
Immigrants from Serbia
Births to Unmarried Women
Births to Unmarried Women Comparison
Inupiat
Immigrants from Serbia
52.1%
BIRTHS TO UNMARRIED WOMEN
0.0/ 100
METRIC RATING
345th/ 347
METRIC RANK
28.3%
BIRTHS TO UNMARRIED WOMEN
98.9/ 100
METRIC RATING
63rd/ 347
METRIC RANK
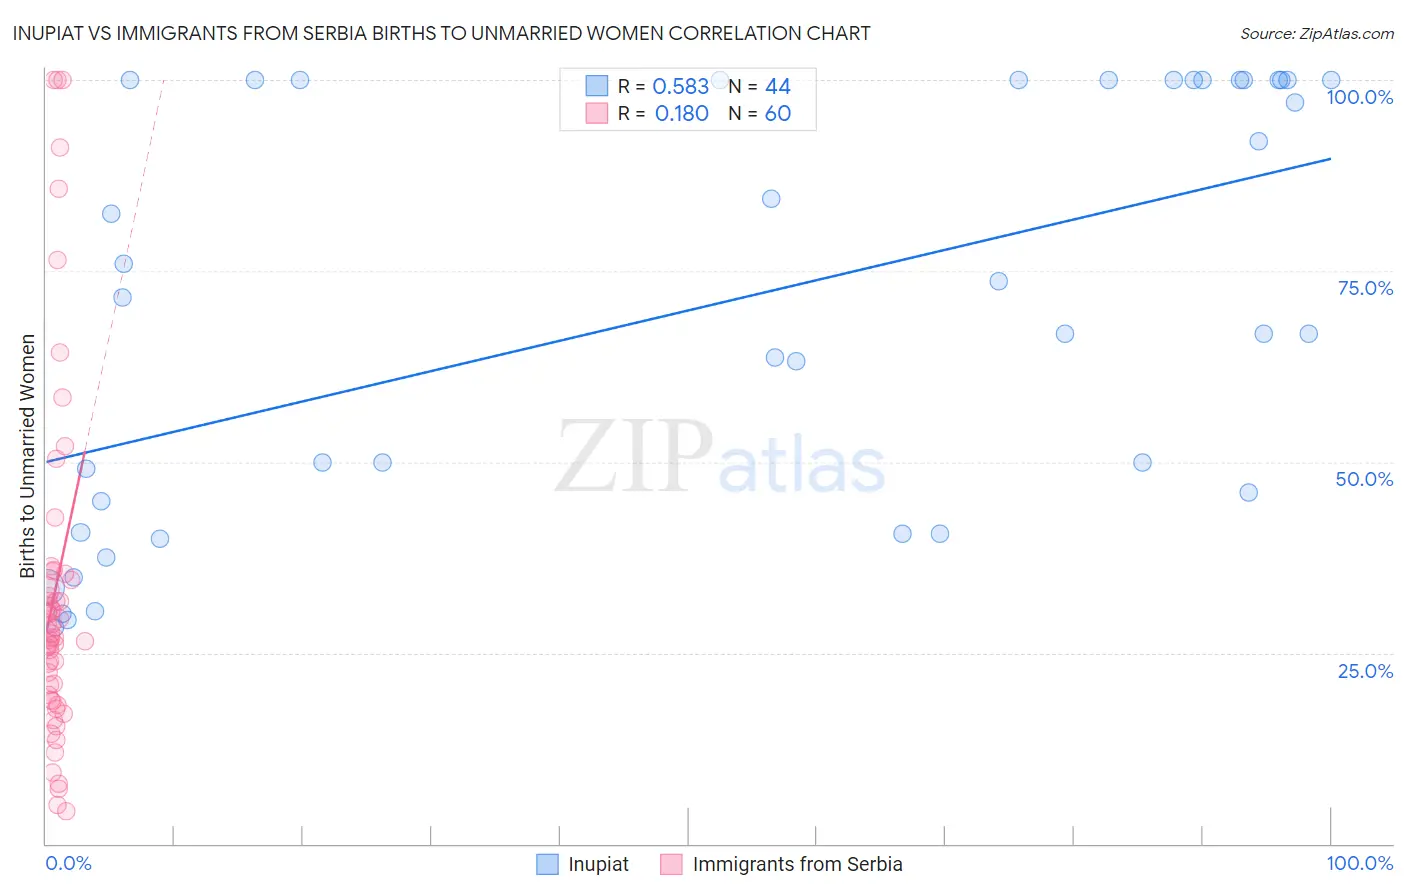
Inupiat vs Immigrants from Serbia Births to Unmarried Women Correlation Chart
The statistical analysis conducted on geographies consisting of 94,892,154 people shows a substantial positive correlation between the proportion of Inupiat and percentage of births to unmarried women in the United States with a correlation coefficient (R) of 0.583 and weighted average of 52.1%. Similarly, the statistical analysis conducted on geographies consisting of 126,646,358 people shows a poor positive correlation between the proportion of Immigrants from Serbia and percentage of births to unmarried women in the United States with a correlation coefficient (R) of 0.180 and weighted average of 28.3%, a difference of 84.3%.
Births to Unmarried Women Correlation Summary
| Measurement | Inupiat | Immigrants from Serbia |
| Minimum | 28.3% | 4.2% |
| Maximum | 100.0% | 100.0% |
| Range | 71.7% | 95.8% |
| Mean | 70.0% | 33.1% |
| Median | 69.1% | 27.0% |
| Interquartile 25% (IQ1) | 42.8% | 19.1% |
| Interquartile 75% (IQ3) | 100.0% | 35.0% |
| Interquartile Range (IQR) | 57.2% | 15.8% |
| Standard Deviation (Sample) | 27.2% | 23.2% |
| Standard Deviation (Population) | 26.9% | 23.0% |
Similar Demographics by Births to Unmarried Women
Demographics Similar to Inupiat by Births to Unmarried Women
In terms of births to unmarried women, the demographic groups most similar to Inupiat are Navajo (51.5%, a difference of 1.2%), Pima (51.5%, a difference of 1.2%), Menominee (51.1%, a difference of 1.9%), Hopi (50.8%, a difference of 2.5%), and Pueblo (53.7%, a difference of 3.0%).
| Demographics | Rating | Rank | Births to Unmarried Women |
| Blacks/African Americans | 0.0 /100 | #333 | Tragic 44.3% |
| Yuman | 0.0 /100 | #334 | Tragic 44.4% |
| Colville | 0.0 /100 | #335 | Tragic 45.3% |
| Puerto Ricans | 0.0 /100 | #336 | Tragic 45.7% |
| Houma | 0.0 /100 | #337 | Tragic 46.6% |
| Arapaho | 0.0 /100 | #338 | Tragic 47.1% |
| Lumbee | 0.0 /100 | #339 | Tragic 48.2% |
| Tohono O'odham | 0.0 /100 | #340 | Tragic 49.8% |
| Hopi | 0.0 /100 | #341 | Tragic 50.8% |
| Menominee | 0.0 /100 | #342 | Tragic 51.1% |
| Pima | 0.0 /100 | #343 | Tragic 51.5% |
| Navajo | 0.0 /100 | #344 | Tragic 51.5% |
| Inupiat | 0.0 /100 | #345 | Tragic 52.1% |
| Pueblo | 0.0 /100 | #346 | Tragic 53.7% |
| Yup'ik | 0.0 /100 | #347 | Tragic 56.4% |
Demographics Similar to Immigrants from Serbia by Births to Unmarried Women
In terms of births to unmarried women, the demographic groups most similar to Immigrants from Serbia are Egyptian (28.2%, a difference of 0.14%), Tongan (28.4%, a difference of 0.38%), Immigrants from Czechoslovakia (28.4%, a difference of 0.40%), Immigrants from Egypt (28.4%, a difference of 0.42%), and Immigrants from North Macedonia (28.1%, a difference of 0.46%).
| Demographics | Rating | Rank | Births to Unmarried Women |
| Immigrants | Belgium | 99.3 /100 | #56 | Exceptional 28.0% |
| Russians | 99.2 /100 | #57 | Exceptional 28.0% |
| Immigrants | Albania | 99.2 /100 | #58 | Exceptional 28.0% |
| Immigrants | Kazakhstan | 99.1 /100 | #59 | Exceptional 28.1% |
| Immigrants | Turkey | 99.1 /100 | #60 | Exceptional 28.1% |
| Immigrants | North Macedonia | 99.1 /100 | #61 | Exceptional 28.1% |
| Egyptians | 99.0 /100 | #62 | Exceptional 28.2% |
| Immigrants | Serbia | 98.9 /100 | #63 | Exceptional 28.3% |
| Tongans | 98.8 /100 | #64 | Exceptional 28.4% |
| Immigrants | Czechoslovakia | 98.8 /100 | #65 | Exceptional 28.4% |
| Immigrants | Egypt | 98.8 /100 | #66 | Exceptional 28.4% |
| Palestinians | 98.7 /100 | #67 | Exceptional 28.4% |
| Immigrants | Europe | 98.7 /100 | #68 | Exceptional 28.4% |
| Bolivians | 98.7 /100 | #69 | Exceptional 28.5% |
| Laotians | 98.6 /100 | #70 | Exceptional 28.5% |