Inupiat vs Delaware Births to Unmarried Women
COMPARE
Inupiat
Delaware
Births to Unmarried Women
Births to Unmarried Women Comparison
Inupiat
Delaware
52.1%
BIRTHS TO UNMARRIED WOMEN
0.0/ 100
METRIC RATING
345th/ 347
METRIC RANK
34.2%
BIRTHS TO UNMARRIED WOMEN
3.3/ 100
METRIC RATING
226th/ 347
METRIC RANK
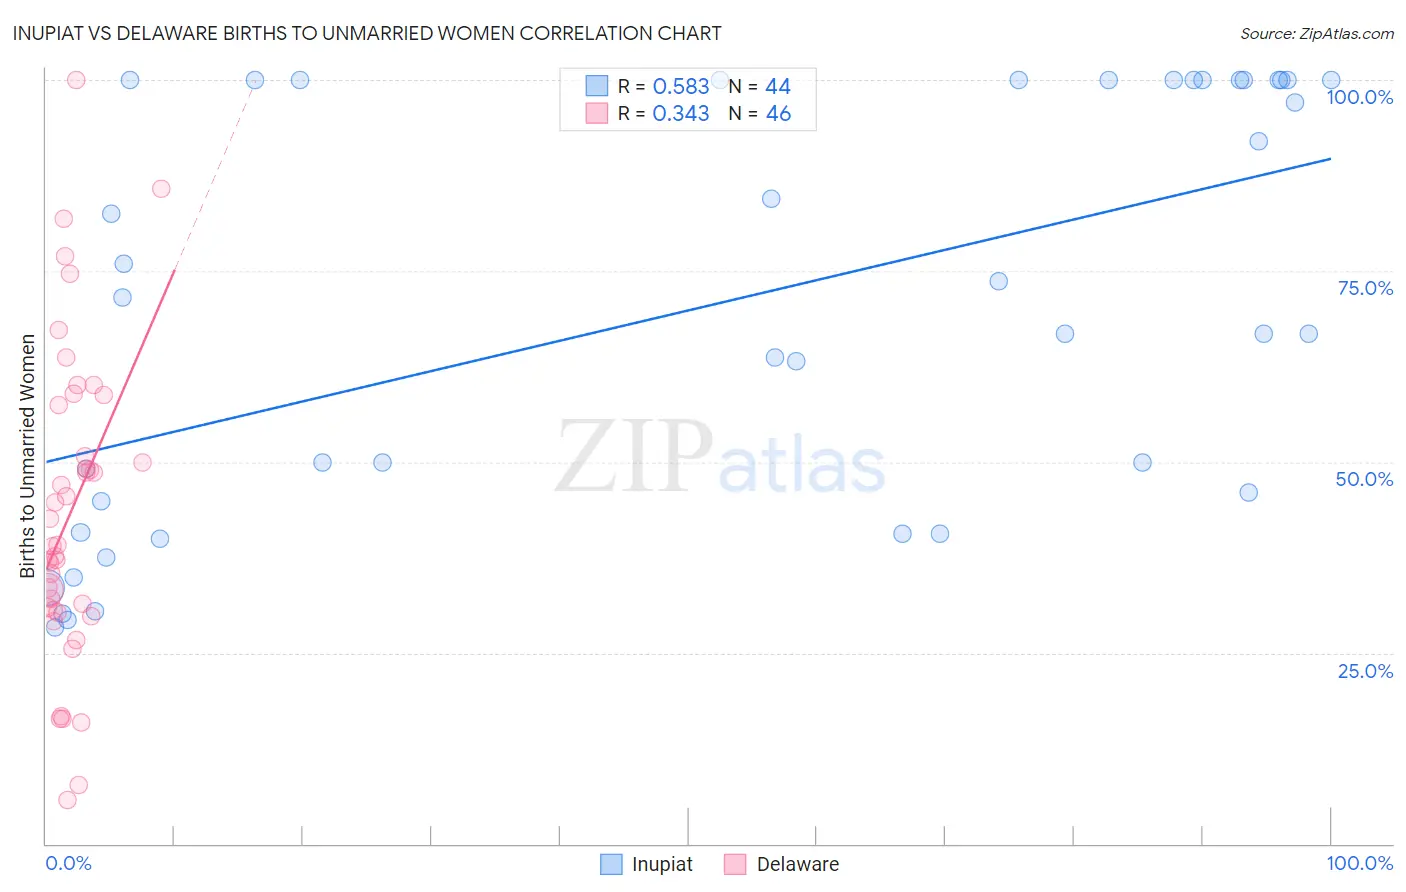
Inupiat vs Delaware Births to Unmarried Women Correlation Chart
The statistical analysis conducted on geographies consisting of 94,892,154 people shows a substantial positive correlation between the proportion of Inupiat and percentage of births to unmarried women in the United States with a correlation coefficient (R) of 0.583 and weighted average of 52.1%. Similarly, the statistical analysis conducted on geographies consisting of 93,888,515 people shows a mild positive correlation between the proportion of Delaware and percentage of births to unmarried women in the United States with a correlation coefficient (R) of 0.343 and weighted average of 34.2%, a difference of 52.4%.
Births to Unmarried Women Correlation Summary
| Measurement | Inupiat | Delaware |
| Minimum | 28.3% | 5.8% |
| Maximum | 100.0% | 100.0% |
| Range | 71.7% | 94.2% |
| Mean | 70.0% | 43.4% |
| Median | 69.1% | 39.0% |
| Interquartile 25% (IQ1) | 42.8% | 30.6% |
| Interquartile 75% (IQ3) | 100.0% | 57.4% |
| Interquartile Range (IQR) | 57.2% | 26.8% |
| Standard Deviation (Sample) | 27.2% | 20.5% |
| Standard Deviation (Population) | 26.9% | 20.2% |
Similar Demographics by Births to Unmarried Women
Demographics Similar to Inupiat by Births to Unmarried Women
In terms of births to unmarried women, the demographic groups most similar to Inupiat are Navajo (51.5%, a difference of 1.2%), Pima (51.5%, a difference of 1.2%), Menominee (51.1%, a difference of 1.9%), Hopi (50.8%, a difference of 2.5%), and Pueblo (53.7%, a difference of 3.0%).
| Demographics | Rating | Rank | Births to Unmarried Women |
| Blacks/African Americans | 0.0 /100 | #333 | Tragic 44.3% |
| Yuman | 0.0 /100 | #334 | Tragic 44.4% |
| Colville | 0.0 /100 | #335 | Tragic 45.3% |
| Puerto Ricans | 0.0 /100 | #336 | Tragic 45.7% |
| Houma | 0.0 /100 | #337 | Tragic 46.6% |
| Arapaho | 0.0 /100 | #338 | Tragic 47.1% |
| Lumbee | 0.0 /100 | #339 | Tragic 48.2% |
| Tohono O'odham | 0.0 /100 | #340 | Tragic 49.8% |
| Hopi | 0.0 /100 | #341 | Tragic 50.8% |
| Menominee | 0.0 /100 | #342 | Tragic 51.1% |
| Pima | 0.0 /100 | #343 | Tragic 51.5% |
| Navajo | 0.0 /100 | #344 | Tragic 51.5% |
| Inupiat | 0.0 /100 | #345 | Tragic 52.1% |
| Pueblo | 0.0 /100 | #346 | Tragic 53.7% |
| Yup'ik | 0.0 /100 | #347 | Tragic 56.4% |
Demographics Similar to Delaware by Births to Unmarried Women
In terms of births to unmarried women, the demographic groups most similar to Delaware are Immigrants from Panama (34.2%, a difference of 0.010%), Panamanian (34.2%, a difference of 0.050%), Immigrants from Sierra Leone (34.2%, a difference of 0.16%), Ghanaian (34.3%, a difference of 0.18%), and Native Hawaiian (34.3%, a difference of 0.32%).
| Demographics | Rating | Rank | Births to Unmarried Women |
| Alsatians | 5.4 /100 | #219 | Tragic 33.8% |
| Portuguese | 5.4 /100 | #220 | Tragic 33.8% |
| Malaysians | 5.0 /100 | #221 | Tragic 33.9% |
| Immigrants | Uruguay | 4.8 /100 | #222 | Tragic 33.9% |
| Pennsylvania Germans | 4.3 /100 | #223 | Tragic 34.0% |
| Immigrants | Laos | 4.3 /100 | #224 | Tragic 34.0% |
| Spanish | 4.0 /100 | #225 | Tragic 34.1% |
| Delaware | 3.3 /100 | #226 | Tragic 34.2% |
| Immigrants | Panama | 3.3 /100 | #227 | Tragic 34.2% |
| Panamanians | 3.3 /100 | #228 | Tragic 34.2% |
| Immigrants | Sierra Leone | 3.1 /100 | #229 | Tragic 34.2% |
| Ghanaians | 3.1 /100 | #230 | Tragic 34.3% |
| Native Hawaiians | 2.9 /100 | #231 | Tragic 34.3% |
| French Canadians | 2.5 /100 | #232 | Tragic 34.4% |
| Bangladeshis | 2.5 /100 | #233 | Tragic 34.4% |