Immigrants from North Macedonia vs Ugandan Single Mother Households
COMPARE
Immigrants from North Macedonia
Ugandan
Single Mother Households
Single Mother Households Comparison
Immigrants from North Macedonia
Ugandans
5.6%
SINGLE MOTHER HOUSEHOLDS
98.6/ 100
METRIC RATING
63rd/ 347
METRIC RANK
6.5%
SINGLE MOTHER HOUSEHOLDS
25.6/ 100
METRIC RATING
185th/ 347
METRIC RANK
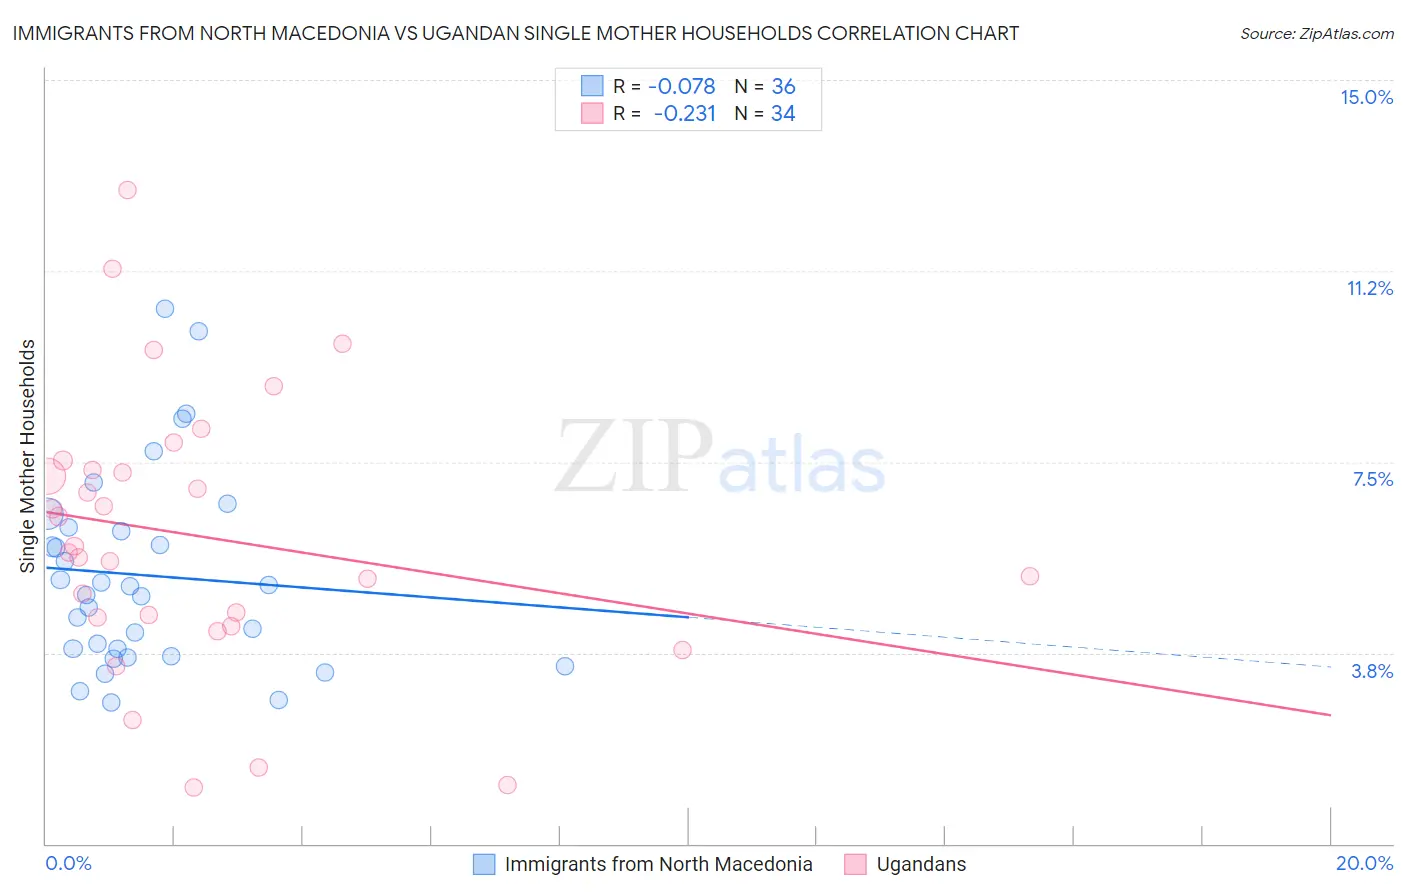
Immigrants from North Macedonia vs Ugandan Single Mother Households Correlation Chart
The statistical analysis conducted on geographies consisting of 74,285,342 people shows a slight negative correlation between the proportion of Immigrants from North Macedonia and percentage of single mother households in the United States with a correlation coefficient (R) of -0.078 and weighted average of 5.6%. Similarly, the statistical analysis conducted on geographies consisting of 93,972,955 people shows a weak negative correlation between the proportion of Ugandans and percentage of single mother households in the United States with a correlation coefficient (R) of -0.231 and weighted average of 6.5%, a difference of 16.5%.
Single Mother Households Correlation Summary
| Measurement | Immigrants from North Macedonia | Ugandan |
| Minimum | 2.8% | 1.1% |
| Maximum | 10.5% | 12.8% |
| Range | 7.7% | 11.7% |
| Mean | 5.3% | 6.0% |
| Median | 5.0% | 5.8% |
| Interquartile 25% (IQ1) | 3.8% | 4.5% |
| Interquartile 75% (IQ3) | 6.2% | 7.3% |
| Interquartile Range (IQR) | 2.4% | 2.9% |
| Standard Deviation (Sample) | 1.9% | 2.7% |
| Standard Deviation (Population) | 1.9% | 2.6% |
Similar Demographics by Single Mother Households
Demographics Similar to Immigrants from North Macedonia by Single Mother Households
In terms of single mother households, the demographic groups most similar to Immigrants from North Macedonia are Immigrants from France (5.6%, a difference of 0.040%), Polish (5.6%, a difference of 0.070%), Australian (5.6%, a difference of 0.080%), Greek (5.6%, a difference of 0.080%), and Immigrants from Norway (5.6%, a difference of 0.15%).
| Demographics | Rating | Rank | Single Mother Households |
| Immigrants | Romania | 99.0 /100 | #56 | Exceptional 5.5% |
| Immigrants | Europe | 99.0 /100 | #57 | Exceptional 5.5% |
| Danes | 98.9 /100 | #58 | Exceptional 5.5% |
| Luxembourgers | 98.7 /100 | #59 | Exceptional 5.6% |
| Immigrants | Norway | 98.7 /100 | #60 | Exceptional 5.6% |
| Australians | 98.7 /100 | #61 | Exceptional 5.6% |
| Poles | 98.6 /100 | #62 | Exceptional 5.6% |
| Immigrants | North Macedonia | 98.6 /100 | #63 | Exceptional 5.6% |
| Immigrants | France | 98.6 /100 | #64 | Exceptional 5.6% |
| Greeks | 98.6 /100 | #65 | Exceptional 5.6% |
| Immigrants | Canada | 98.5 /100 | #66 | Exceptional 5.6% |
| Italians | 98.5 /100 | #67 | Exceptional 5.6% |
| Immigrants | Bulgaria | 98.5 /100 | #68 | Exceptional 5.6% |
| Asians | 98.5 /100 | #69 | Exceptional 5.6% |
| Immigrants | Eastern Europe | 98.4 /100 | #70 | Exceptional 5.6% |
Demographics Similar to Ugandans by Single Mother Households
In terms of single mother households, the demographic groups most similar to Ugandans are Ethiopian (6.5%, a difference of 0.060%), Costa Rican (6.5%, a difference of 0.11%), Immigrants from Afghanistan (6.5%, a difference of 0.13%), Ottawa (6.5%, a difference of 0.26%), and Spaniard (6.5%, a difference of 0.30%).
| Demographics | Rating | Rank | Single Mother Households |
| Portuguese | 40.0 /100 | #178 | Fair 6.4% |
| Hmong | 39.8 /100 | #179 | Fair 6.4% |
| Immigrants | Nepal | 36.1 /100 | #180 | Fair 6.4% |
| Spanish | 33.4 /100 | #181 | Fair 6.4% |
| South American Indians | 33.4 /100 | #182 | Fair 6.4% |
| Spaniards | 27.8 /100 | #183 | Fair 6.5% |
| Ethiopians | 26.0 /100 | #184 | Fair 6.5% |
| Ugandans | 25.6 /100 | #185 | Fair 6.5% |
| Costa Ricans | 24.8 /100 | #186 | Fair 6.5% |
| Immigrants | Afghanistan | 24.7 /100 | #187 | Fair 6.5% |
| Ottawa | 23.8 /100 | #188 | Fair 6.5% |
| Delaware | 23.3 /100 | #189 | Fair 6.5% |
| Peruvians | 21.6 /100 | #190 | Fair 6.5% |
| Samoans | 21.2 /100 | #191 | Fair 6.5% |
| Americans | 19.0 /100 | #192 | Poor 6.6% |