Mexican vs Immigrants from Nigeria Family Households
COMPARE
Mexican
Immigrants from Nigeria
Family Households
Family Households Comparison
Mexicans
Immigrants from Nigeria
69.0%
FAMILY HOUSEHOLDS
100.0/ 100
METRIC RATING
7th/ 347
METRIC RANK
64.4%
FAMILY HOUSEHOLDS
60.1/ 100
METRIC RATING
164th/ 347
METRIC RANK
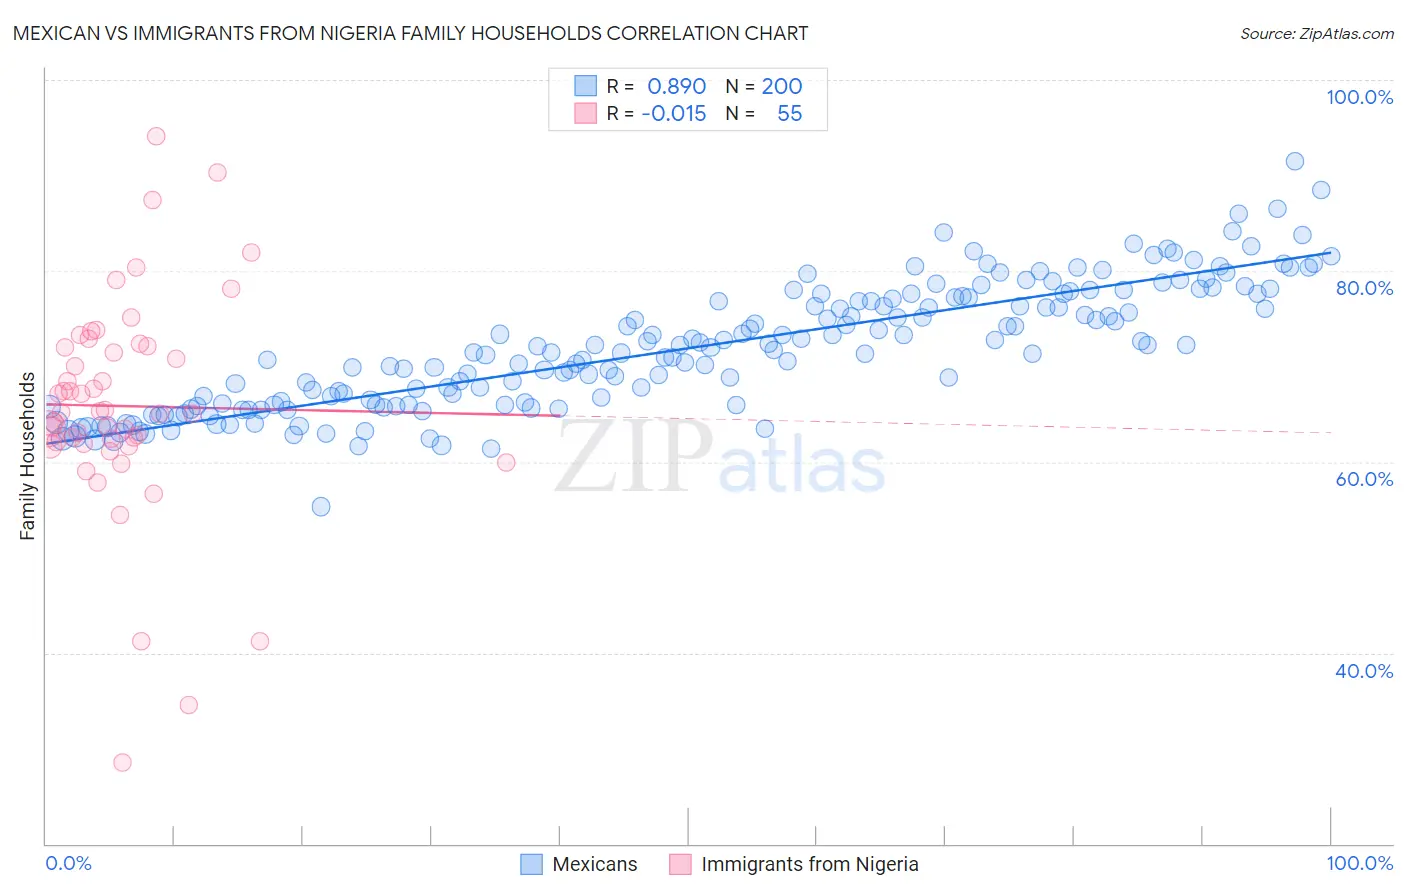
Mexican vs Immigrants from Nigeria Family Households Correlation Chart
The statistical analysis conducted on geographies consisting of 564,667,700 people shows a very strong positive correlation between the proportion of Mexicans and percentage of family households in the United States with a correlation coefficient (R) of 0.890 and weighted average of 69.0%. Similarly, the statistical analysis conducted on geographies consisting of 283,303,761 people shows no correlation between the proportion of Immigrants from Nigeria and percentage of family households in the United States with a correlation coefficient (R) of -0.015 and weighted average of 64.4%, a difference of 7.1%.
Family Households Correlation Summary
| Measurement | Mexican | Immigrants from Nigeria |
| Minimum | 55.3% | 28.6% |
| Maximum | 91.5% | 94.1% |
| Range | 36.2% | 65.6% |
| Mean | 71.9% | 65.9% |
| Median | 71.6% | 65.1% |
| Interquartile 25% (IQ1) | 66.0% | 61.8% |
| Interquartile 75% (IQ3) | 77.1% | 72.1% |
| Interquartile Range (IQR) | 11.1% | 10.2% |
| Standard Deviation (Sample) | 6.5% | 11.7% |
| Standard Deviation (Population) | 6.5% | 11.6% |
Similar Demographics by Family Households
Demographics Similar to Mexicans by Family Households
In terms of family households, the demographic groups most similar to Mexicans are Immigrants from Mexico (69.1%, a difference of 0.21%), Immigrants from Fiji (68.8%, a difference of 0.32%), Yuman (69.3%, a difference of 0.45%), Yakama (69.3%, a difference of 0.47%), and Native Hawaiian (68.4%, a difference of 0.88%).
| Demographics | Rating | Rank | Family Households |
| Yup'ik | 100 /100 | #1 | Exceptional 72.4% |
| Spanish American Indians | 100.0 /100 | #2 | Exceptional 71.2% |
| Tongans | 100.0 /100 | #3 | Exceptional 69.6% |
| Yakama | 100.0 /100 | #4 | Exceptional 69.3% |
| Yuman | 100.0 /100 | #5 | Exceptional 69.3% |
| Immigrants | Mexico | 100.0 /100 | #6 | Exceptional 69.1% |
| Mexicans | 100.0 /100 | #7 | Exceptional 69.0% |
| Immigrants | Fiji | 100.0 /100 | #8 | Exceptional 68.8% |
| Native Hawaiians | 100.0 /100 | #9 | Exceptional 68.4% |
| Immigrants | Philippines | 100.0 /100 | #10 | Exceptional 68.3% |
| Immigrants | Central America | 100.0 /100 | #11 | Exceptional 68.3% |
| Koreans | 100.0 /100 | #12 | Exceptional 68.3% |
| Pueblo | 100.0 /100 | #13 | Exceptional 68.2% |
| Immigrants | Cuba | 100.0 /100 | #14 | Exceptional 68.2% |
| Assyrians/Chaldeans/Syriacs | 100.0 /100 | #15 | Exceptional 68.2% |
Demographics Similar to Immigrants from Nigeria by Family Households
In terms of family households, the demographic groups most similar to Immigrants from Nigeria are Immigrants from Southern Europe (64.4%, a difference of 0.0%), Scotch-Irish (64.4%, a difference of 0.010%), British (64.4%, a difference of 0.020%), Chickasaw (64.4%, a difference of 0.020%), and Irish (64.4%, a difference of 0.030%).
| Demographics | Rating | Rank | Family Households |
| Canadians | 66.6 /100 | #157 | Good 64.4% |
| Lebanese | 66.4 /100 | #158 | Good 64.4% |
| Germans | 65.8 /100 | #159 | Good 64.4% |
| Immigrants | Moldova | 65.2 /100 | #160 | Good 64.4% |
| Immigrants | England | 62.6 /100 | #161 | Good 64.4% |
| British | 61.6 /100 | #162 | Good 64.4% |
| Chickasaw | 61.5 /100 | #163 | Good 64.4% |
| Immigrants | Nigeria | 60.1 /100 | #164 | Good 64.4% |
| Immigrants | Southern Europe | 60.0 /100 | #165 | Good 64.4% |
| Scotch-Irish | 59.2 /100 | #166 | Average 64.4% |
| Irish | 57.9 /100 | #167 | Average 64.4% |
| Hondurans | 57.5 /100 | #168 | Average 64.4% |
| Iraqis | 56.0 /100 | #169 | Average 64.4% |
| Armenians | 55.9 /100 | #170 | Average 64.4% |
| Ute | 54.6 /100 | #171 | Average 64.3% |