Immigrants from Eritrea vs Soviet Union Family Households
COMPARE
Immigrants from Eritrea
Soviet Union
Family Households
Family Households Comparison
Immigrants from Eritrea
Soviet Union
60.8%
FAMILY HOUSEHOLDS
0.0/ 100
METRIC RATING
338th/ 347
METRIC RANK
60.9%
FAMILY HOUSEHOLDS
0.0/ 100
METRIC RATING
337th/ 347
METRIC RANK
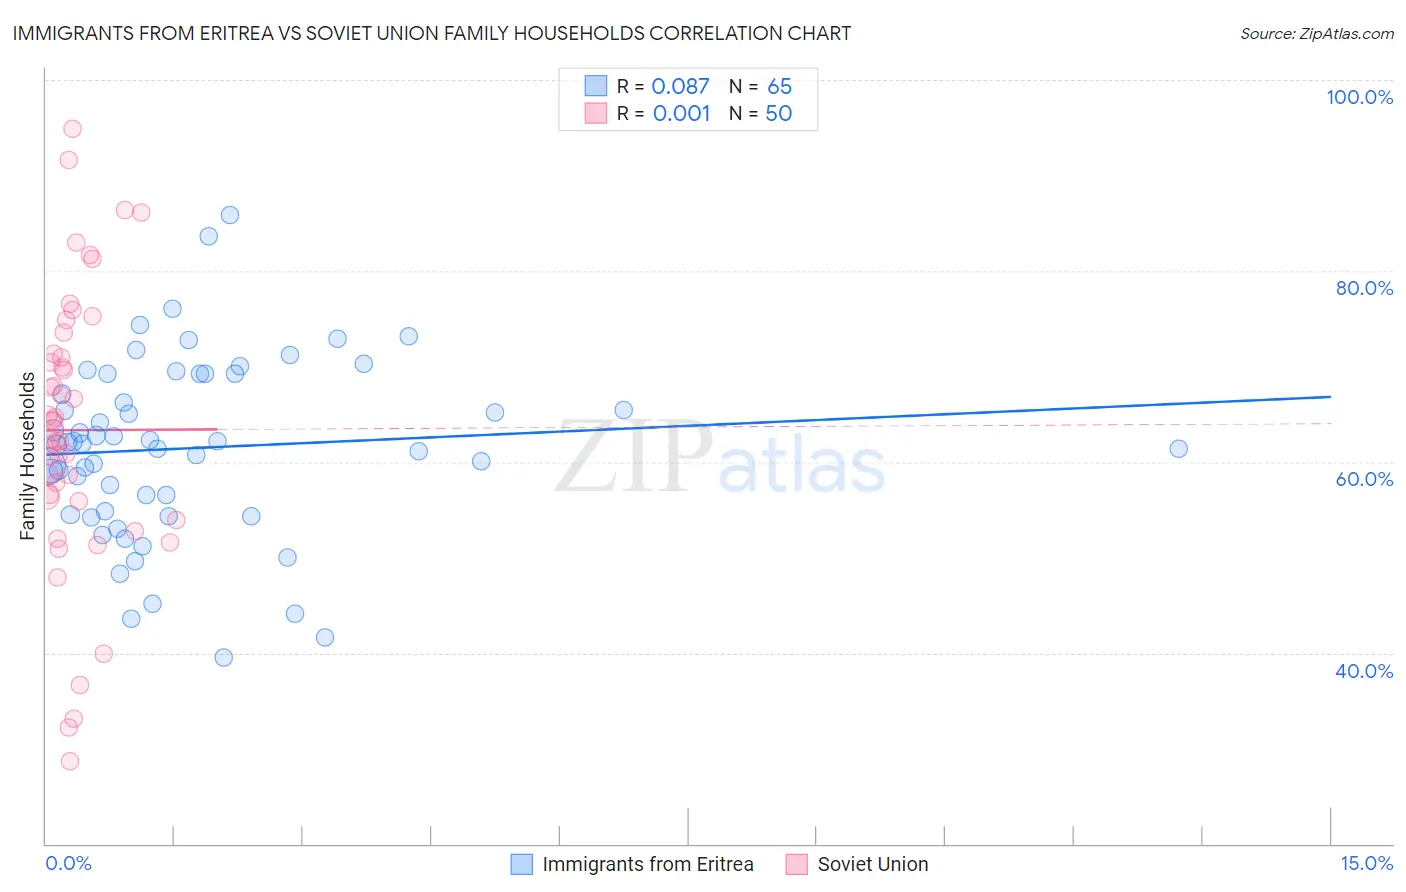
Immigrants from Eritrea vs Soviet Union Family Households Correlation Chart
The statistical analysis conducted on geographies consisting of 104,847,164 people shows a slight positive correlation between the proportion of Immigrants from Eritrea and percentage of family households in the United States with a correlation coefficient (R) of 0.087 and weighted average of 60.8%. Similarly, the statistical analysis conducted on geographies consisting of 43,509,630 people shows no correlation between the proportion of Soviet Union and percentage of family households in the United States with a correlation coefficient (R) of 0.001 and weighted average of 60.9%, a difference of 0.14%.
Family Households Correlation Summary
| Measurement | Immigrants from Eritrea | Soviet Union |
| Minimum | 39.5% | 28.6% |
| Maximum | 85.9% | 94.9% |
| Range | 46.3% | 66.3% |
| Mean | 61.4% | 63.3% |
| Median | 61.9% | 63.3% |
| Interquartile 25% (IQ1) | 54.6% | 55.8% |
| Interquartile 75% (IQ3) | 69.2% | 71.4% |
| Interquartile Range (IQR) | 14.6% | 15.5% |
| Standard Deviation (Sample) | 9.4% | 14.7% |
| Standard Deviation (Population) | 9.3% | 14.5% |
Demographics Similar to Immigrants from Eritrea and Soviet Union by Family Households
In terms of family households, the demographic groups most similar to Immigrants from Eritrea are German Russian (60.9%, a difference of 0.14%), Immigrants from Saudi Arabia (60.7%, a difference of 0.20%), Carpatho Rusyn (61.1%, a difference of 0.42%), Immigrants from Eastern Africa (61.1%, a difference of 0.54%), and Immigrants from Ethiopia (61.2%, a difference of 0.62%). Similarly, the demographic groups most similar to Soviet Union are German Russian (60.9%, a difference of 0.0%), Carpatho Rusyn (61.1%, a difference of 0.28%), Immigrants from Saudi Arabia (60.7%, a difference of 0.34%), Immigrants from Eastern Africa (61.1%, a difference of 0.40%), and Immigrants from Ethiopia (61.2%, a difference of 0.48%).
| Demographics | Rating | Rank | Family Households |
| Blacks/African Americans | 0.0 /100 | #327 | Tragic 61.5% |
| Kiowa | 0.0 /100 | #328 | Tragic 61.4% |
| Cambodians | 0.0 /100 | #329 | Tragic 61.4% |
| Immigrants | Australia | 0.0 /100 | #330 | Tragic 61.3% |
| Immigrants | France | 0.0 /100 | #331 | Tragic 61.3% |
| Ethiopians | 0.0 /100 | #332 | Tragic 61.2% |
| Immigrants | Ethiopia | 0.0 /100 | #333 | Tragic 61.2% |
| Immigrants | Eastern Africa | 0.0 /100 | #334 | Tragic 61.1% |
| Carpatho Rusyns | 0.0 /100 | #335 | Tragic 61.1% |
| German Russians | 0.0 /100 | #336 | Tragic 60.9% |
| Soviet Union | 0.0 /100 | #337 | Tragic 60.9% |
| Immigrants | Eritrea | 0.0 /100 | #338 | Tragic 60.8% |
| Immigrants | Saudi Arabia | 0.0 /100 | #339 | Tragic 60.7% |
| Immigrants | Sudan | 0.0 /100 | #340 | Tragic 60.2% |
| Immigrants | Senegal | 0.0 /100 | #341 | Tragic 60.1% |
| Sudanese | 0.0 /100 | #342 | Tragic 60.0% |
| Senegalese | 0.0 /100 | #343 | Tragic 59.8% |
| Immigrants | Congo | 0.0 /100 | #344 | Tragic 59.2% |
| Immigrants | Zaire | 0.0 /100 | #345 | Tragic 59.2% |
| Somalis | 0.0 /100 | #346 | Tragic 57.6% |
| Immigrants | Somalia | 0.0 /100 | #347 | Tragic 56.7% |