Moroccan vs Soviet Union Family Households
COMPARE
Moroccan
Soviet Union
Family Households
Family Households Comparison
Moroccans
Soviet Union
61.9%
FAMILY HOUSEHOLDS
0.0/ 100
METRIC RATING
315th/ 347
METRIC RANK
60.9%
FAMILY HOUSEHOLDS
0.0/ 100
METRIC RATING
337th/ 347
METRIC RANK
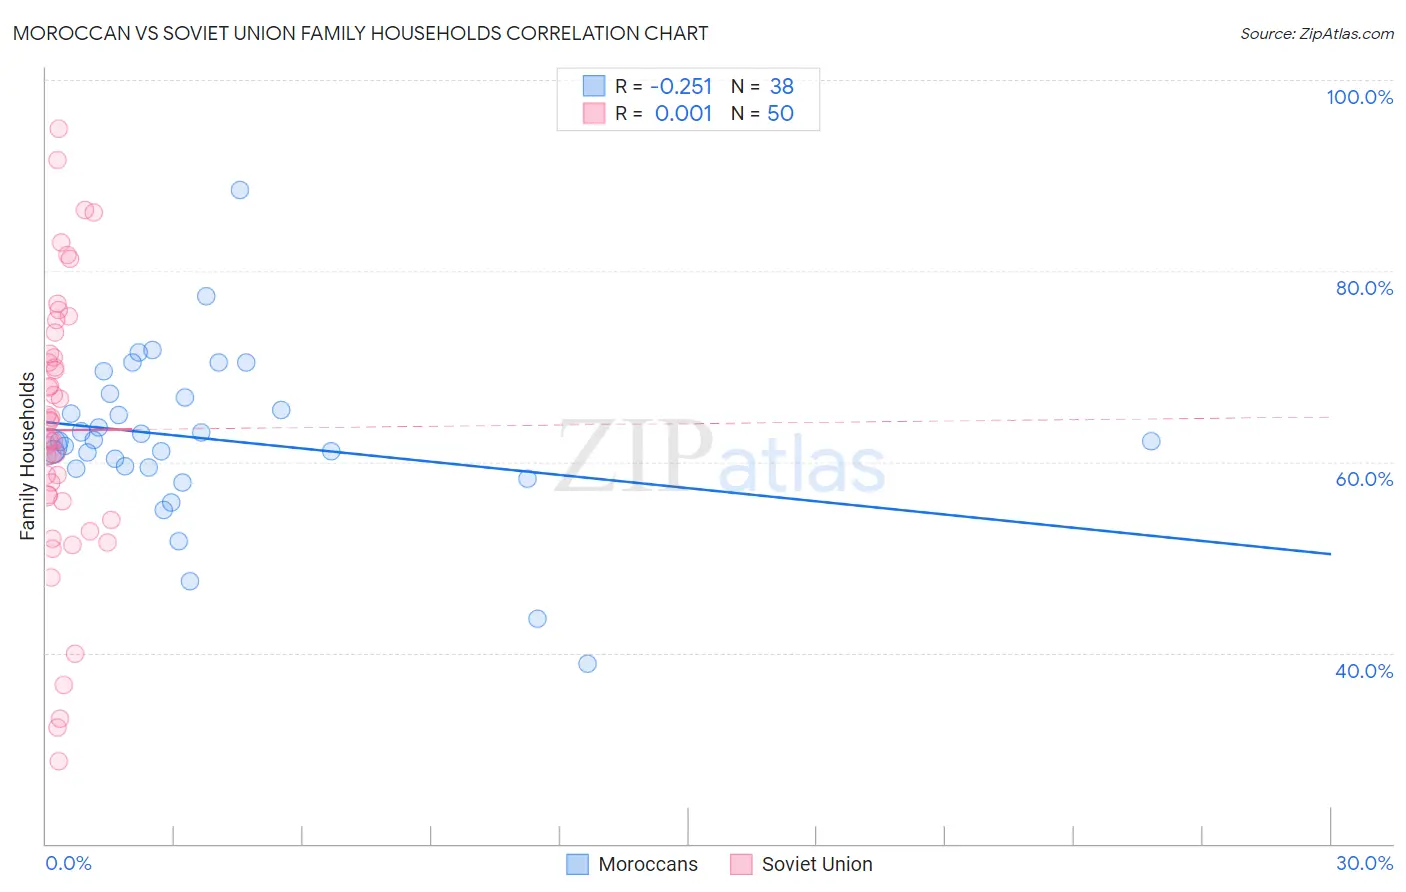
Moroccan vs Soviet Union Family Households Correlation Chart
The statistical analysis conducted on geographies consisting of 201,760,179 people shows a weak negative correlation between the proportion of Moroccans and percentage of family households in the United States with a correlation coefficient (R) of -0.251 and weighted average of 61.9%. Similarly, the statistical analysis conducted on geographies consisting of 43,509,630 people shows no correlation between the proportion of Soviet Union and percentage of family households in the United States with a correlation coefficient (R) of 0.001 and weighted average of 60.9%, a difference of 1.7%.
Family Households Correlation Summary
| Measurement | Moroccan | Soviet Union |
| Minimum | 38.9% | 28.6% |
| Maximum | 88.5% | 94.9% |
| Range | 49.6% | 66.3% |
| Mean | 62.4% | 63.3% |
| Median | 62.1% | 63.3% |
| Interquartile 25% (IQ1) | 59.3% | 55.8% |
| Interquartile 75% (IQ3) | 66.7% | 71.4% |
| Interquartile Range (IQR) | 7.4% | 15.5% |
| Standard Deviation (Sample) | 8.7% | 14.7% |
| Standard Deviation (Population) | 8.6% | 14.5% |
Similar Demographics by Family Households
Demographics Similar to Moroccans by Family Households
In terms of family households, the demographic groups most similar to Moroccans are Immigrants from Cabo Verde (61.9%, a difference of 0.040%), Immigrants from Middle Africa (61.9%, a difference of 0.040%), Immigrants from Bosnia and Herzegovina (61.9%, a difference of 0.080%), Liberian (62.0%, a difference of 0.090%), and Immigrants from Latvia (62.0%, a difference of 0.10%).
| Demographics | Rating | Rank | Family Households |
| Chippewa | 0.0 /100 | #308 | Tragic 62.1% |
| Sub-Saharan Africans | 0.0 /100 | #309 | Tragic 62.1% |
| Immigrants | Liberia | 0.0 /100 | #310 | Tragic 62.0% |
| Immigrants | Morocco | 0.0 /100 | #311 | Tragic 62.0% |
| Immigrants | Latvia | 0.0 /100 | #312 | Tragic 62.0% |
| Liberians | 0.0 /100 | #313 | Tragic 62.0% |
| Immigrants | Cabo Verde | 0.0 /100 | #314 | Tragic 61.9% |
| Moroccans | 0.0 /100 | #315 | Tragic 61.9% |
| Immigrants | Middle Africa | 0.0 /100 | #316 | Tragic 61.9% |
| Immigrants | Bosnia and Herzegovina | 0.0 /100 | #317 | Tragic 61.9% |
| Alaskan Athabascans | 0.0 /100 | #318 | Tragic 61.8% |
| Cape Verdeans | 0.0 /100 | #319 | Tragic 61.8% |
| Ugandans | 0.0 /100 | #320 | Tragic 61.7% |
| Alsatians | 0.0 /100 | #321 | Tragic 61.7% |
| Immigrants | Serbia | 0.0 /100 | #322 | Tragic 61.6% |
Demographics Similar to Soviet Union by Family Households
In terms of family households, the demographic groups most similar to Soviet Union are German Russian (60.9%, a difference of 0.0%), Immigrants from Eritrea (60.8%, a difference of 0.14%), Carpatho Rusyn (61.1%, a difference of 0.28%), Immigrants from Saudi Arabia (60.7%, a difference of 0.34%), and Immigrants from Eastern Africa (61.1%, a difference of 0.40%).
| Demographics | Rating | Rank | Family Households |
| Immigrants | Australia | 0.0 /100 | #330 | Tragic 61.3% |
| Immigrants | France | 0.0 /100 | #331 | Tragic 61.3% |
| Ethiopians | 0.0 /100 | #332 | Tragic 61.2% |
| Immigrants | Ethiopia | 0.0 /100 | #333 | Tragic 61.2% |
| Immigrants | Eastern Africa | 0.0 /100 | #334 | Tragic 61.1% |
| Carpatho Rusyns | 0.0 /100 | #335 | Tragic 61.1% |
| German Russians | 0.0 /100 | #336 | Tragic 60.9% |
| Soviet Union | 0.0 /100 | #337 | Tragic 60.9% |
| Immigrants | Eritrea | 0.0 /100 | #338 | Tragic 60.8% |
| Immigrants | Saudi Arabia | 0.0 /100 | #339 | Tragic 60.7% |
| Immigrants | Sudan | 0.0 /100 | #340 | Tragic 60.2% |
| Immigrants | Senegal | 0.0 /100 | #341 | Tragic 60.1% |
| Sudanese | 0.0 /100 | #342 | Tragic 60.0% |
| Senegalese | 0.0 /100 | #343 | Tragic 59.8% |
| Immigrants | Congo | 0.0 /100 | #344 | Tragic 59.2% |